Introduction
Over the last few years, monitoring technology has taken a leap and helped free the many physical constraints carry-on sensors like GPS-trackers, accelerometers, and gyroscopes posed. This has paved the way for academic research in the field of tracking and classifying data collected from numerous human activities through means of wearable smartwatches. The aim of this research project is to deeply explore the various possibilities of context-aware application in the field of strength training. The objective is achieved through means of collecting, preprocessing, and analyzing raw data collected from wristband gyroscopes and accelerometers obtained during workout sessions.
Numerous works from past have been focused on tracking movements and analyzing user feedback through means of exercises. However, these systems do not entirely replace the tasks fulfilled by personal trainers. Weight training, similar to cardiovascular aerobic exercises is an essential aspect to health and fitness. However, there are yet to be many wearable devices that track the strength training exercises. At the moment there is only one wearable device that identifies exercise and tracks the repetitions in a set.
As further advancements occur in context-aware applications, it should eventually lead to the development of digital personal trainers driven by artificial intelligence. First and foremost, a personal trainer must possess adequate knowledge of human anatomy and basics of training and nutrition. Moreover, the trainer should be adept enough to design a personal training program for the client. And lastly, the trainer should assess the form and have a method to track progress.
Moreover, by offering real-time feedback and tailored recommendations based on an individual's biomechanics, tracked fitness level, and goals, artificial intelligence algorithms can be incorporated into wearable devices and have the potential to completely revolutionize the weightlifting industry. Akin to having a virtual personal trainer, powered by AI-driven solution at the disposal whenever needed will help improve performance, customize workout plan, and overall enhance the quality of exercise. This would maximize training efficiency and reduce the risk of injury.
Integration of machine learning algorithms into wearable devices like metamotions and apple watches opens up possibilities for real-time analysis of biomechanical metrics during strength training sessions. Upon leveraging the gathered data obtained in the form of accelerometer and gyroscope measurements can provide in-depth insights into factors such as exercise form, joint angles, and the amount of exerted force. Such detailed feedback can help people engaging in strength training sessions to fix their form, refine their repetition, and prevent risk of injuries by prior identification of potential areas vulnerable to strain or imbalance.
In addition to improving individual workouts, such applications developed with the aid of machine learning algorithms can also facilitate and encourage a broader engagement to the community of fitness where participants are striving to become the best version of themselves and actively sharing knowledge amongst each other. Such a collaborative ecosystem will not only foster accountability and motivation but also accelerate the collective learning curve as the participants benefit significantly from each other’s experiences. Finally, the quantization of individual fitness metrics will improve individual support that will further lead to more effective training practices that involve people of all skill levels and backgrounds.

Questions to be Answered
- Who will benefit most from this research project?
- What were the primary objectives of investigating context-aware applications in strength training, and what motivated this research?
- Was the data collection method viable for further extension of this study? What type of sensors were utilized
- What was the optimal number of clusters? How were the different exercises classified
- What were the primary goal of the participants for participating in this project?
- People seeking to optimize their weightlifting training program and trying to get into science-based lifting.
- The objective of this project was to investigate the potential possibilities of context-aware applications in the domain of strength training. The impetus for this project was the lack of focus on the implementation of context-aware applications in the field of activity tracker devices.
- Data has been collected from Metamotions, a wearable device that offers real-time and continuous monitoring of motion and environmental sensor data. The raw data involves accelerometer and gyroscope measurements of all the participants involved during their workout session. Dataset was created after itering over numerous files of raw data, cleaning it, preprocessing it, and finally merging it into one pickle dataset. The reason the dataset was exported as pickle over csv is because it involved numerous timestamps in epoch. Accelerometer and gyroscope sensors were utilized.
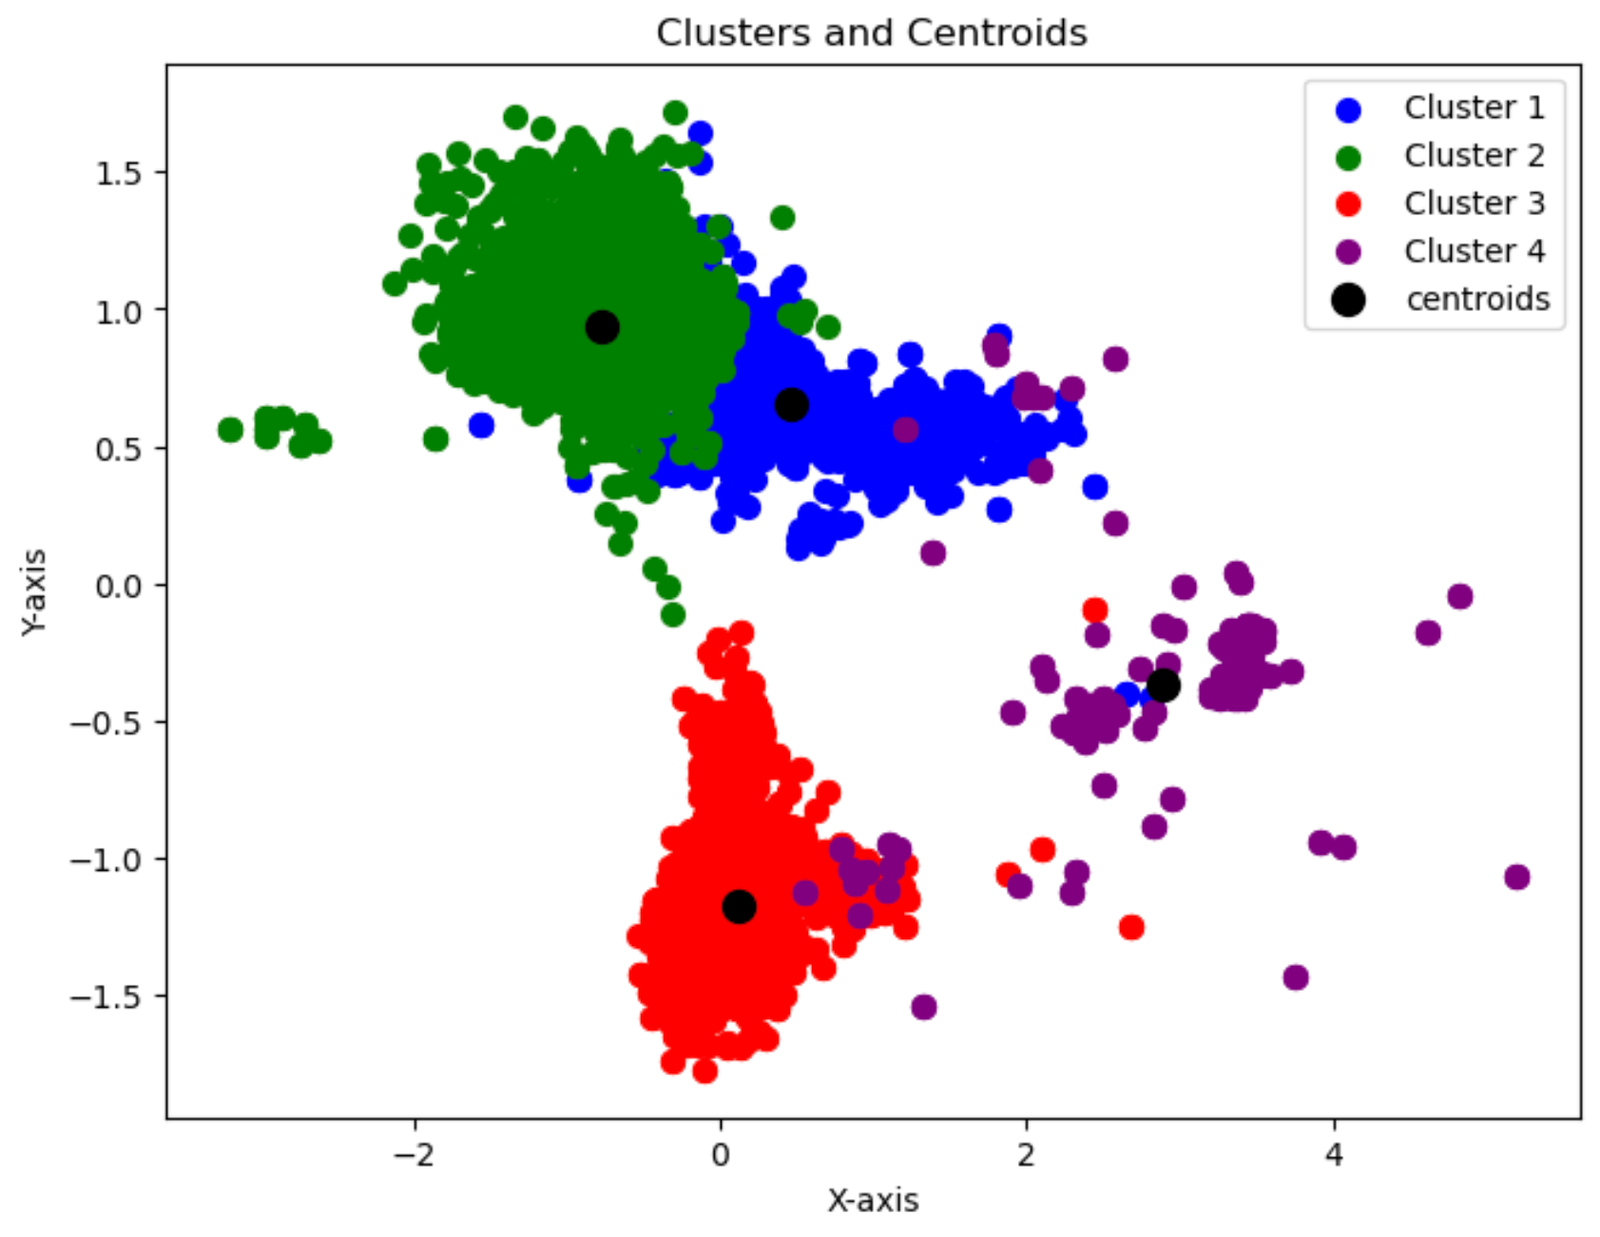
- After performing some Clustering tests the optimal number of clusters was determined to be 4 upon analyzing the elbow plot and determining the silhouette score. Cluster 1 covers almost all of the bench press and overhead press data. This could be attributed to the fact that both exercises involve similar patterns of movement. Squat is captured in cluster 2 while the deadlift and row are captured in cluster 3. Cluster 4 captures the remainder of the data but fails to classify them accurately.
- To further optimize their training and workout sessions in order to pursue a higher level of fitness
- Which was the best model for classification of different compound movements?
- How does quantification and tracking one's fitness correlates with one's overall fitness level?
- Are there any type of specific weight training that appear to be similar?
- Why different exercises are classified as same in some instances?
- Assessing correlation between psychological factors and the measurements generated in accelerometer and gyroscope. Ascertain the fact how psychological factors affect the training?
- Decision tree and random forest appear to be the best model with accuracy score of ~98%
- Quantification and tracking of fitness through means of context-aware applications can enable personalized monitoring leading to enhanced overall fitness by offering insights into the exercise patterns, form, and progress.
- Benchpress and overhead press were classified as similar in a number of instances. Similar situation happen in regards to deadlift and row.
- Benchpress and overheadpress involved similar movement patterns during execution. Same appears to be true for deadlift and rows
- No proper conclusion was reached regarding this question
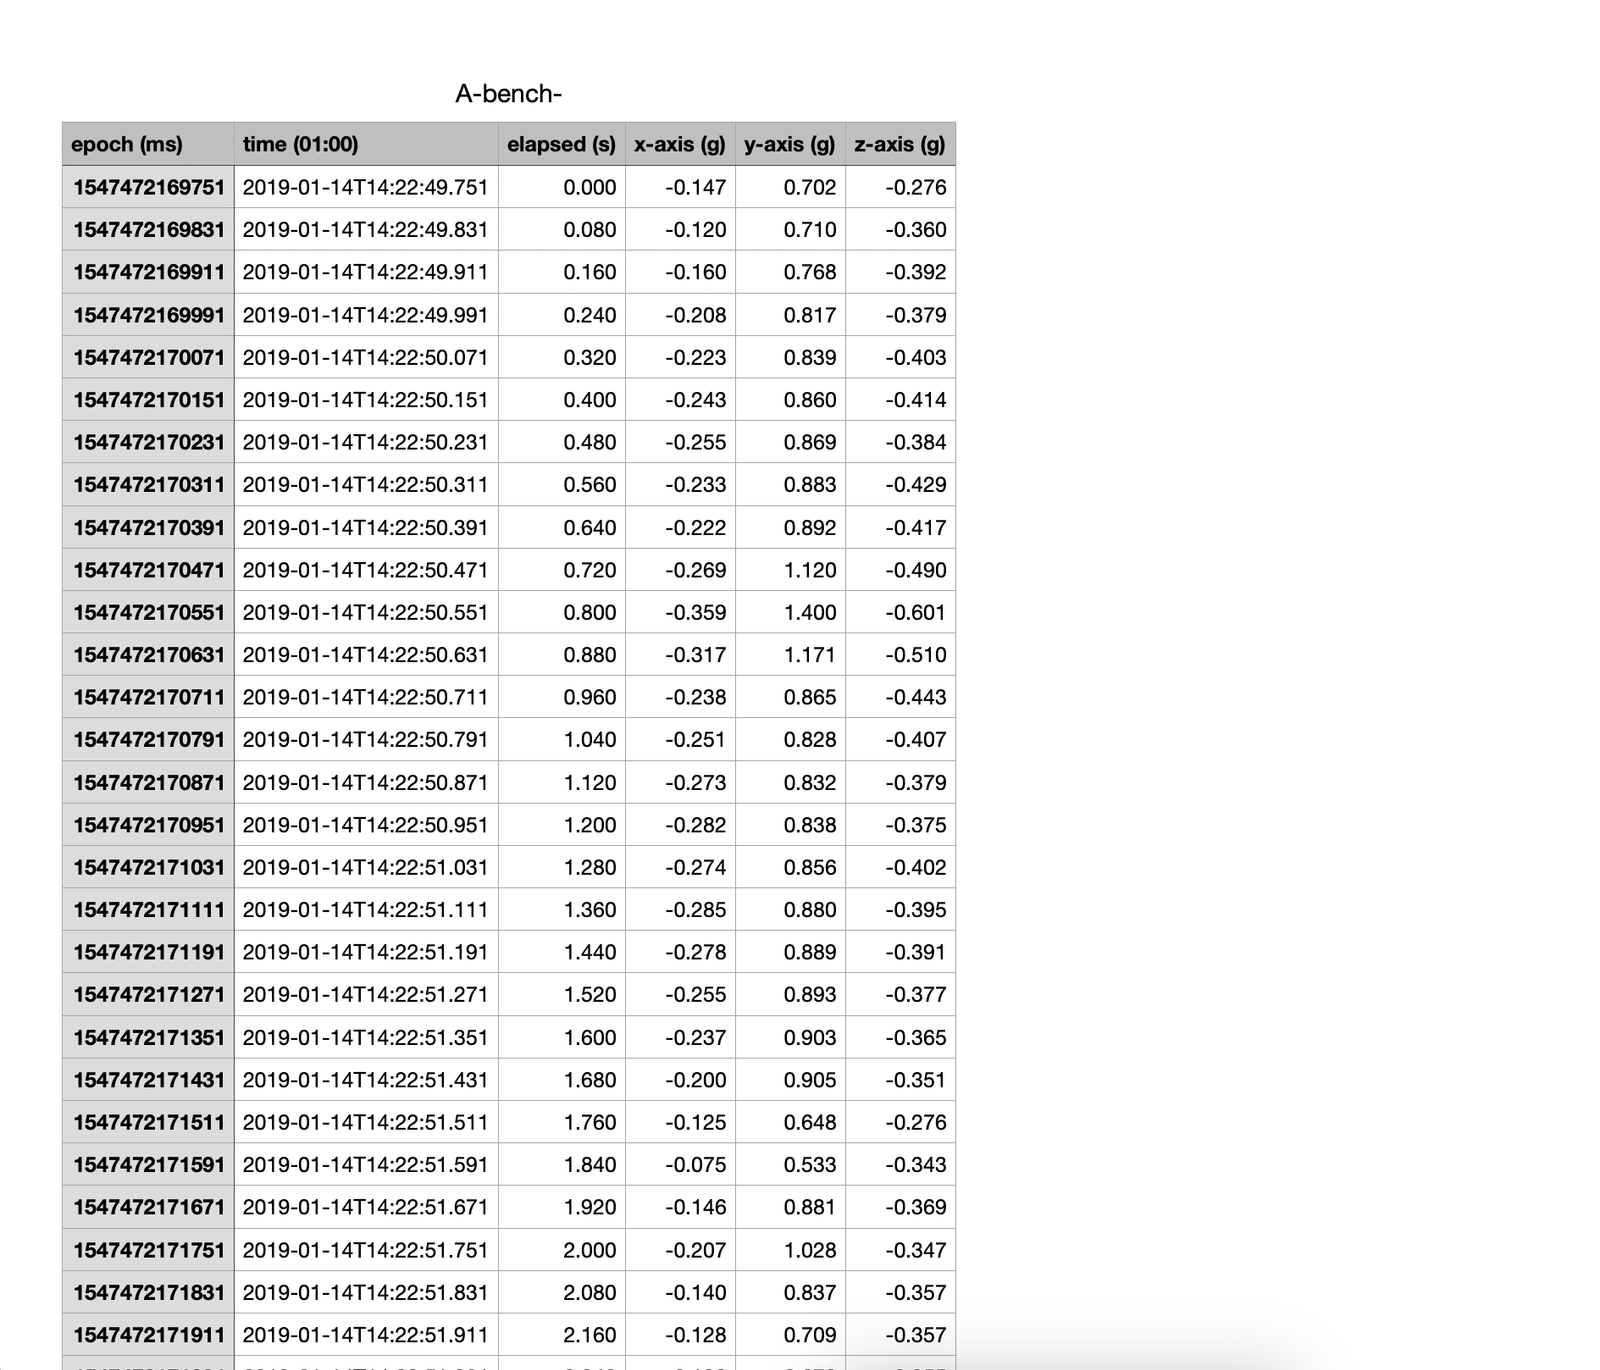
Snippet 1

Data Preparation
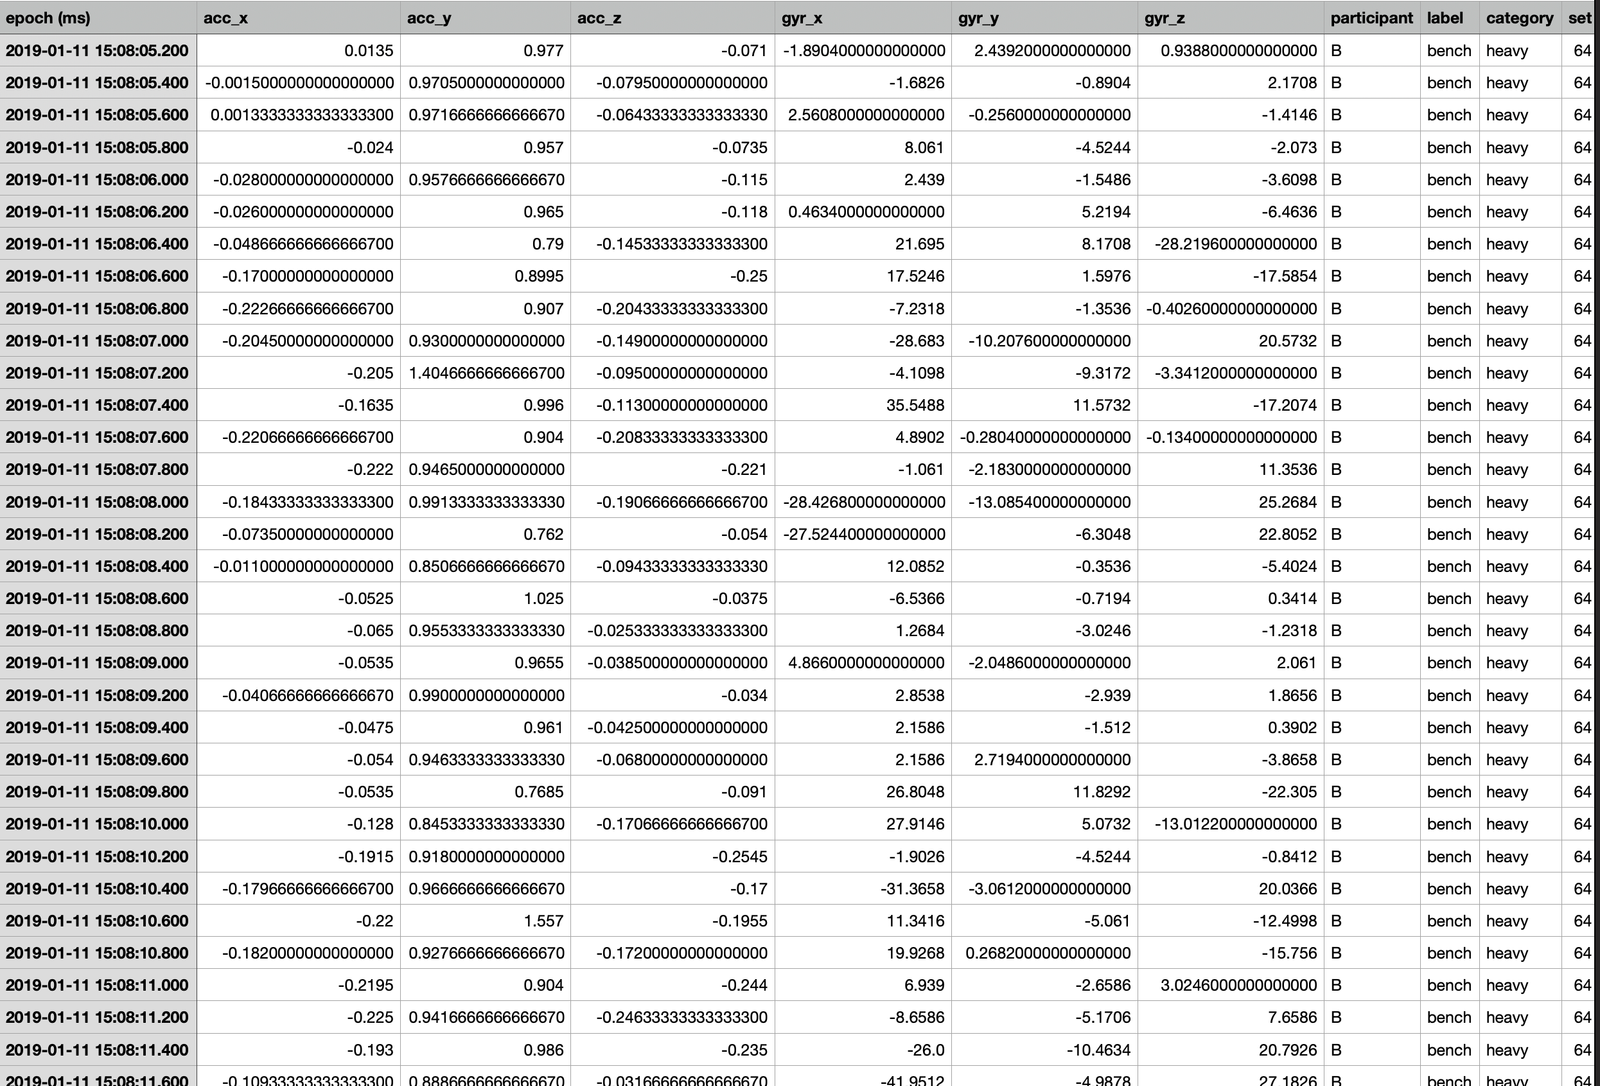
Data has been collected from Metamotions, a wearable device that offers real-time and continuous monitoring of motion and environmental sensor data. The raw data involves accelerometer and gyroscope measurements of all the participants involved during their workout session. Dataset was created after itering over numerous files of raw data, cleaning it, preprocessing it, and finally merging it into one pickle dataset. The reason the dataset was exported as pickle over csv is because it involved numerous timestamps in epoch. Snippet 1 next to the text gives a brief glimpse of the raw data files that has been gathered. Snippet 2 is a snippet of one of the files that measured benchpress movement of participant A. Snippet 3, the lower rightmost image is the picture of final dataset the project will be using.
Snippet 2
Snippet 3
Exploratory Data Analysis
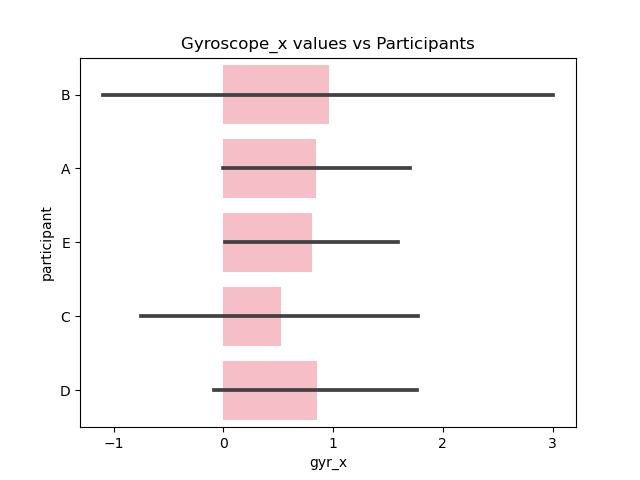
Since the data cleaning and preprocessing took such a long time only minor data exploration is done centered around the accelerometer and gyroscope measurements along different axes with the type of exercise (label).
Figure 1
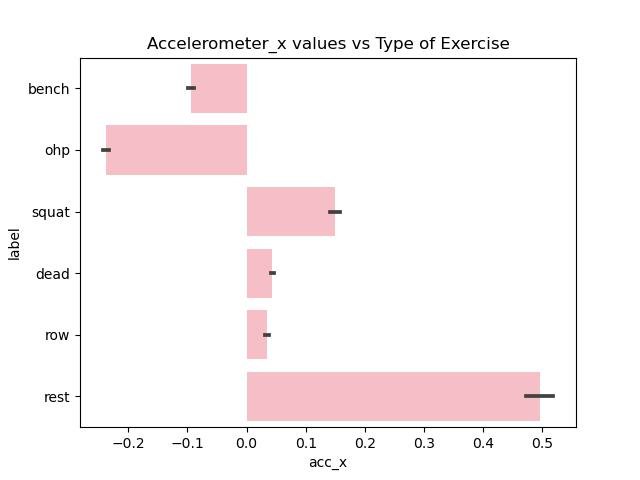
Figure 2

Figure 3
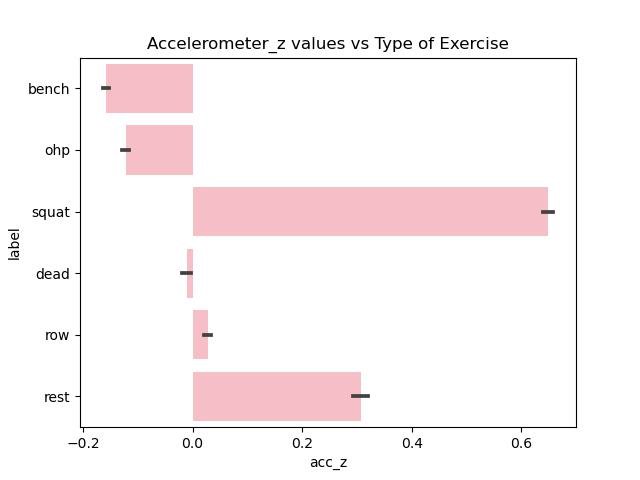
Figure 4
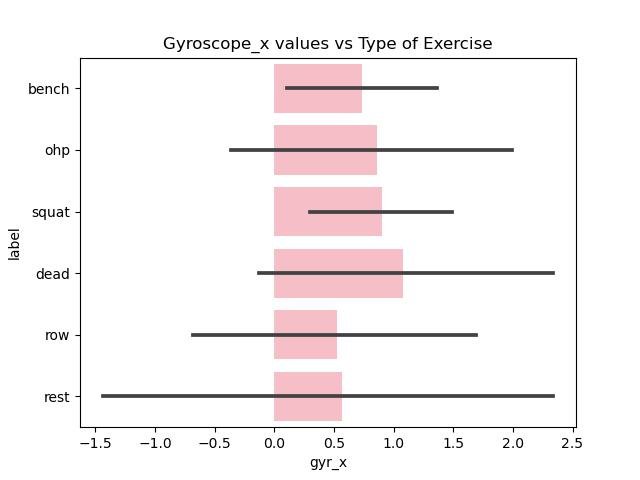
Figure 5
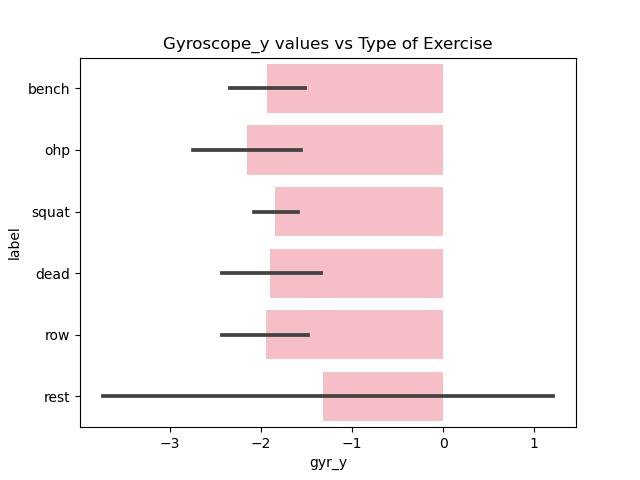
Figure 6
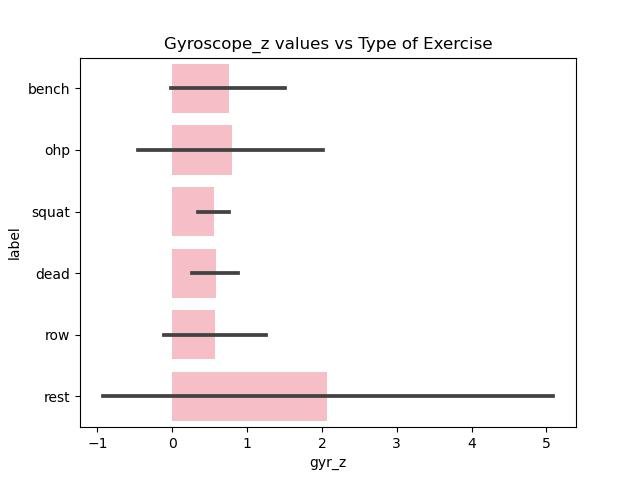
Figure 7
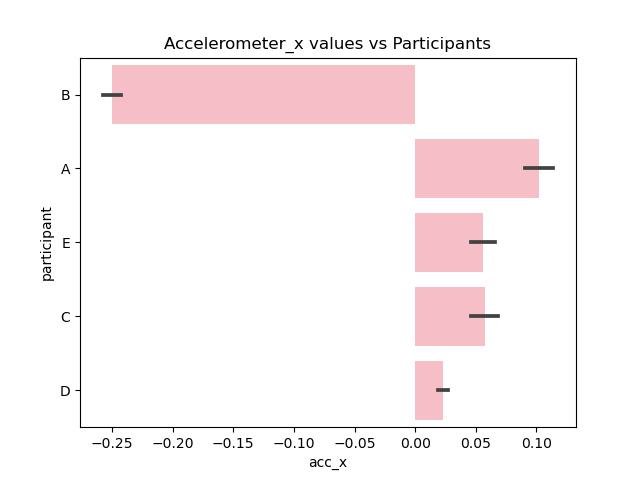
Figure 8

Figure 9
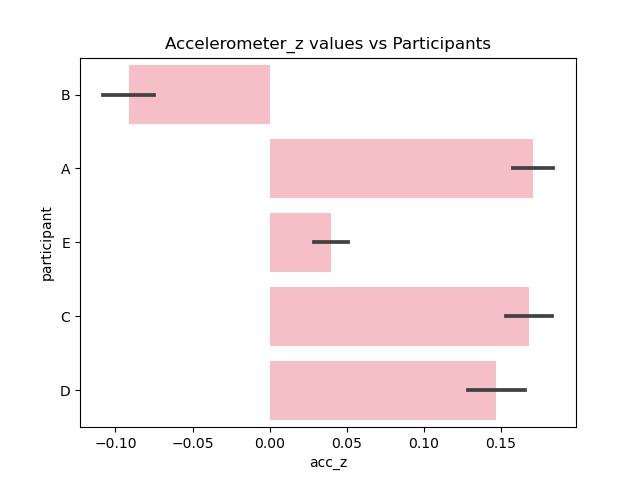
Figure 10
Clustering
Overview
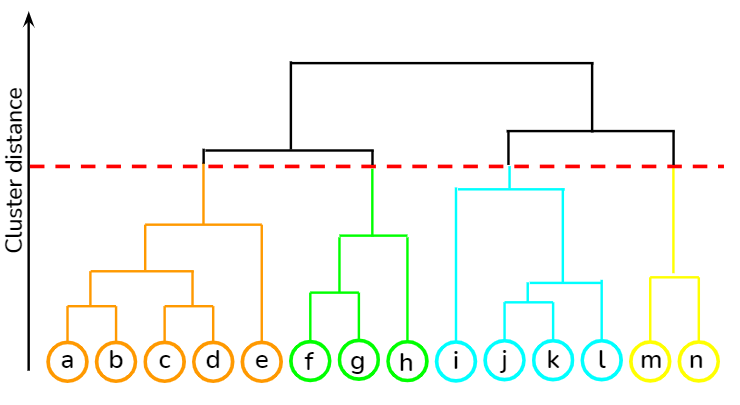
Clustering is an algorithm that falls under unsupervised learning that groups similar unlabeled data points together. It is implemented to identify similar patterns or structures within a given dataset. Hierarchical clustering is a type of clustering algorithm that organizes data points into a hierarchy of clusters and forms a dendogram. It can either be agglomerative where clusters are grouped together based on proximity, or divisive where the clusters are split in a recursive manner. Distance metrics like Euclidean distance or Gower distance also impacts the result of the clustering algorithm.
Data Prep
Data has been collected from Metamotions, a wearable device that offers real-time and continuous monitoring of motion and environmental sensor data. The raw data involves accelerometer and gyroscope measurements of all the participants involved during their workout session. Dataset was created after itering over numerous files of raw data, cleaning it, preprocessing it, and finally merging it into one pickle dataset. The reason the dataset was exported as pickle over csv is because it involved numerous timestamps in epoch.
Before Transformation
After Transformation
Results and Conclusion
Elbow Plot

Silhouette Plot

Clustering Scatter Plot
Dendogram - Hierarchical Clustering

As we can see, clustering is the right approach for this model. However, Principal Component Analysis along with outlier detection should be performed before clustering as we can see from the above scatter plot that it is affecting the clustering solution. A clear elbow point from the elbow plot is hard to determine as the rate of decrease is pretty linear. However, from the elbow plot we can conclude that 3-5 clusters are ideal. The silhouette score is maximum at 4 as evident from the plot which peaks at 4. It means that a 4 cluster solution will have maximum inter-cluster similarity and least intra-cluster correlation. Thus, from the above elbow and silhouette plot we can conclude for this particular dataset 4 cluster solution is ideal. Moreover, 50 sample data points are sampled from the large dataset to get proper legible labels for the dendogram. We can conclude from the dendogram it is taking form of agglomerative clustering rather than divisive and 4 clusters can be recognized. The vertical line represents the distance between clusters.
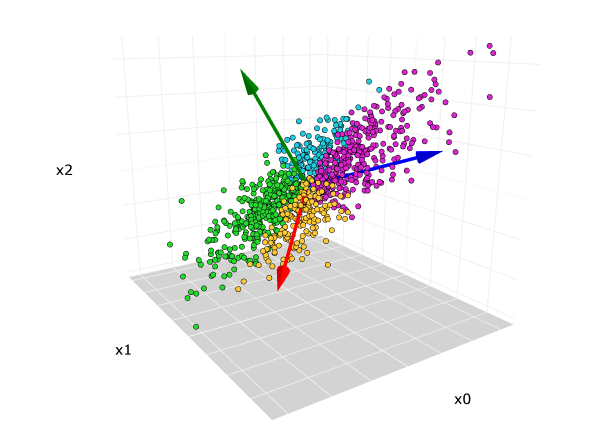
Principal Component Analysis
Overview
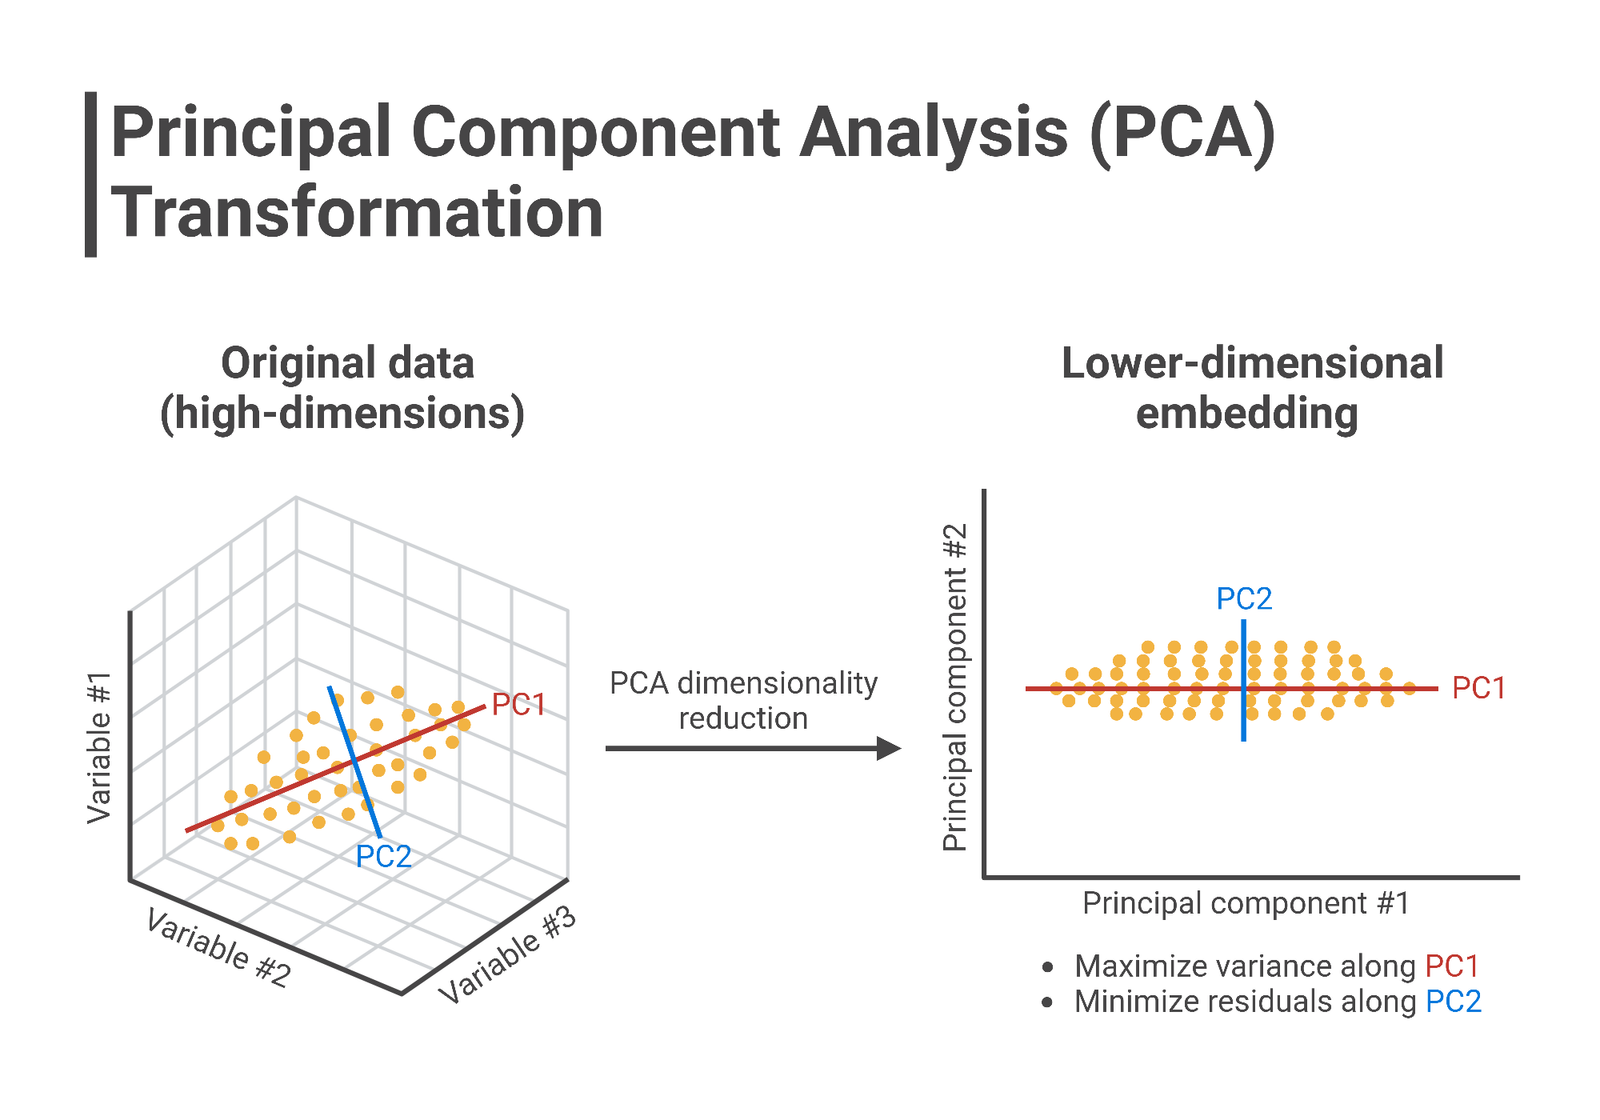
Principal Component Analysis (PCA) is a method for reducing dimension of a complex dataset while preserving maximum possible explanatory power of the dataset. The method transforms the original features into principal components, ordered by their variance. PCA maximizes data variance along these components and helps in visualization and data compression for machine learning purposes. PCA projects original features onto orthogonal directions (principal components) where data variance is maximum. The next steps of the project is to perform clustering and PCA again but after performing outlier detection.
Data Prep
Data has been collected from Metamotions, a wearable device that offers real-time and continuous monitoring of motion and environmental sensor data. The raw data involves accelerometer and gyroscope measurements of all the participants involved during their workout session. Dataset was created after itering over numerous files of raw data, cleaning it, preprocessing it, and finally merging it into one pickle dataset. The reason the dataset was exported as pickle over csv is because it involved numerous timestamps in epoch.
Before Transformation
Atfer Transformation


It takes 4 principal components to retain 90% of the explanatory power (shown in the code). On the other hand, 2 principal components can only explain ~51% of the dataset information. The conclusion can only be draw after performing outlier detection and then implementing the PCA method again. The score plot shows how different data points are distributed along 2 PCs categorized by the type of exercise such as bench press, deadlift, overhead press, rows, and so on.
Naive Bayes
Overview
In the field of probabilistic classifiers, Naïve Bayes algorithms – such as Multinomial NB and Bernoulli NB are fundamental, especially for text classification purposes. Under the assumption of feature independence, the multinomial NB model is a probabilistic classifier built on the basis of Bayes Theorem. In its essence, it multiplies the odds of each feature happening in a particular class and normalizes the result by the total likelihood of the features that determines the probability of a given class consisting of numerous features. Text classification tasks are a perfect fit for the model because features are usually used in such cases to indicate frequencies of words or their presence in documents. Sentiment Analysis being one such example. An essential aspect of NB model training is taking smoothing into account as it prevents the model from assigning zero probability to unseen data during the prediction phase. It is essential to smooth out scenarios where specific feature-value combinations have zero probabilities in the training data.


Data Prep
Data has been collected from Metamotions, a wearable device that offers real-time and continuous monitoring of motion and environmental sensor data. The raw data involves accelerometer and gyroscope measurements of all the participants involved during their workout session. Dataset was created after itering over numerous files of raw data, cleaning it, preprocessing it, and finally merging it into one pickle dataset. The reason the dataset was exported as pickle over csv is because it involved numerous timestamps in epoch.
Before Transformation
Cleaned Data
Trained Data


We judge that the Naive Bayes theorem is not a suitable fit for our dataset as our goal is to assess how quantification and tracking one's fitness correlates with one's overall fitness level. Moreover, after analyzing the confusion matrix and accuracy level of 0.59 we can conclude that it is not ideal.
Decison Trees
Overview
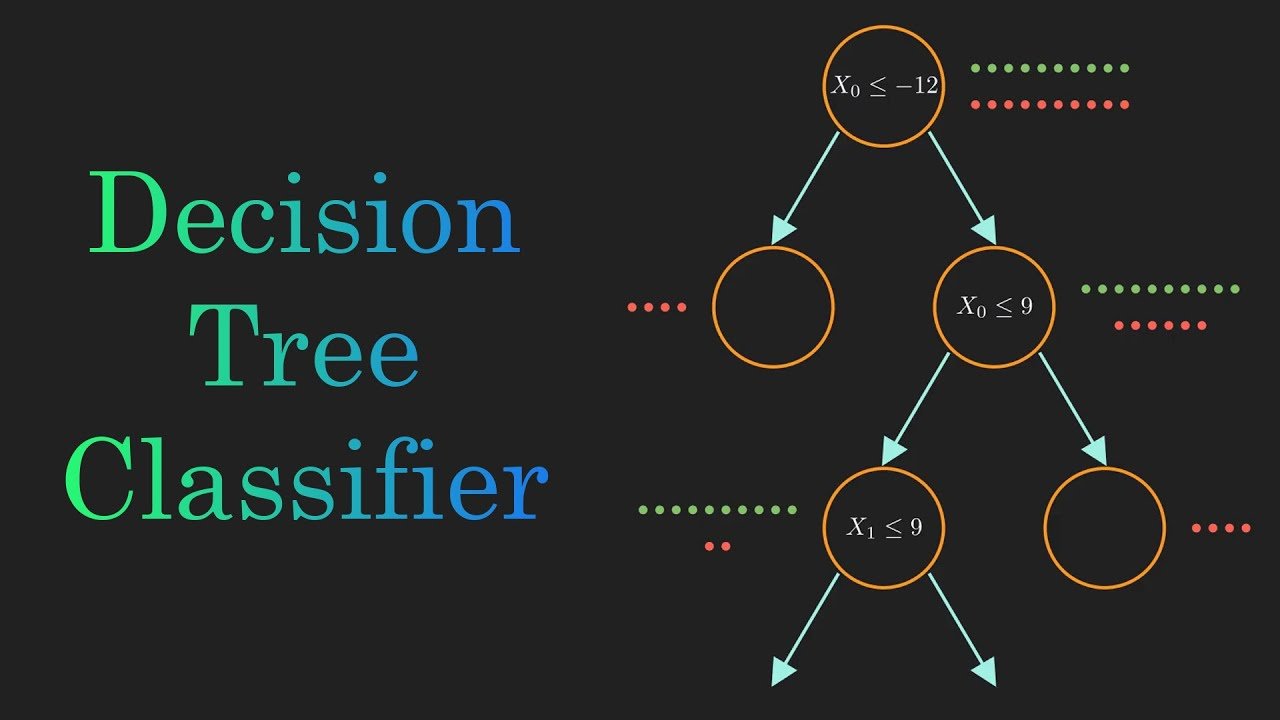
Decision trees provide a straightforward, yet efficient method to solve the problems related to regression and classification. In order to generate segments that optimize homogeneity within subsegments, the algorithm recursively chooses optimal features to split the data based on a certain predetermined criteria at the training phase. During this phase, a number of criteria for splitting are evaluated such as information gain, entropy, and Gini impurity. Gini impurity measures how often a randomly selected element from the data set is incorrectly labeled. Entropy measures the amount of disorder in a data set. Once the decision tree is built, prediction of future instances requires navigating the tree on the basis of input features, going from root node to the appropriate leaf node. The algorithm assesses the feature linked to each internal node and proceeds along the relevant branch according to the feature value.

Data Prep
Data has been collected from Metamotions, a wearable device that offers real-time and continuous monitoring of motion and environmental sensor data. The raw data involves accelerometer and gyroscope measurements of all the participants involved during their workout session. Dataset was created after itering over numerous files of raw data, cleaning it, preprocessing it, and finally merging it into one pickle dataset. The reason the dataset was exported as pickle over csv is because it involved numerous timestamps in epoch.
Before Transformation
Cleaned Data
Trained Data

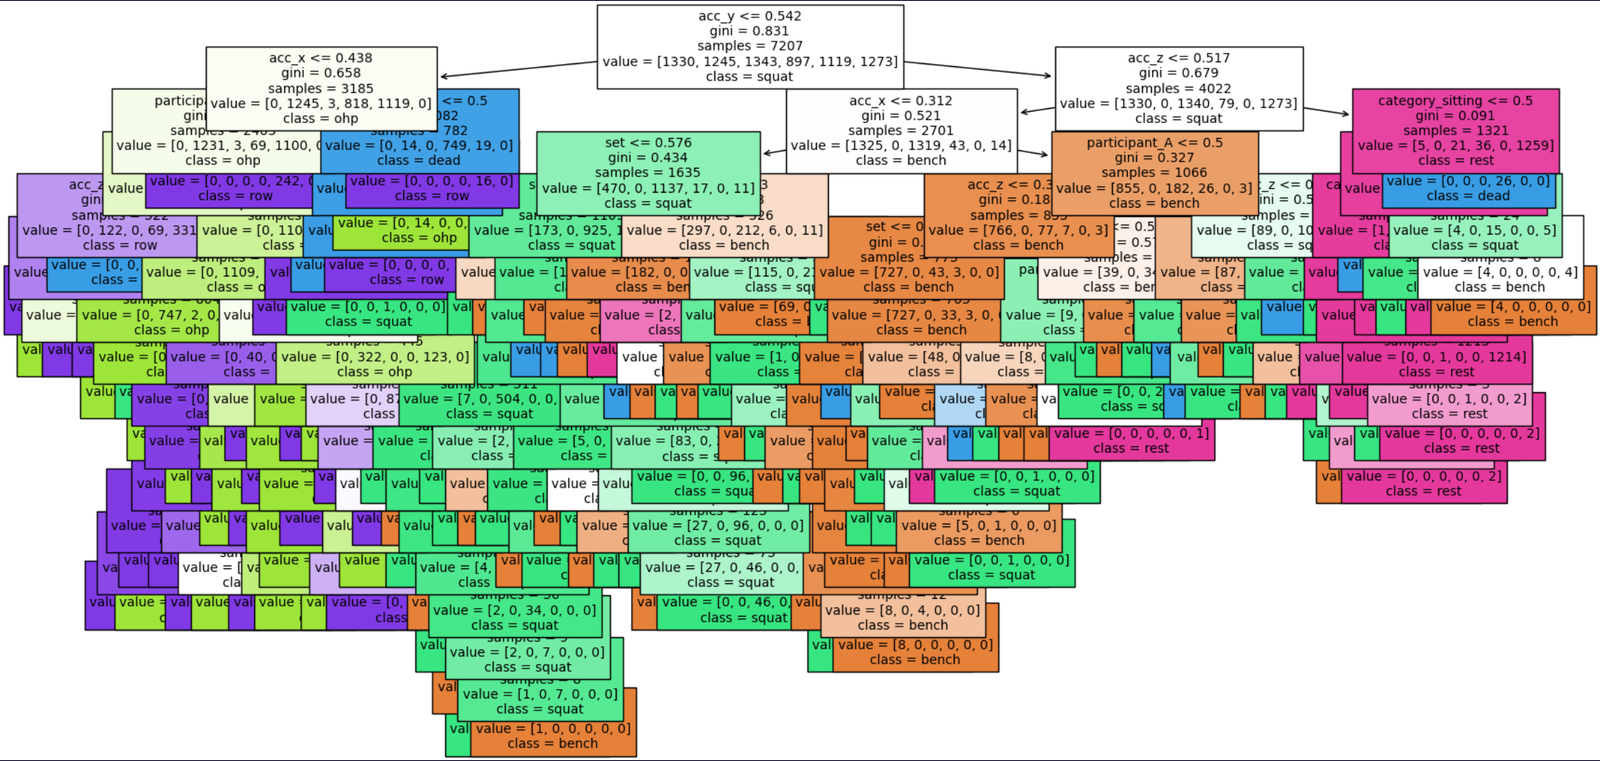
Decision Tree
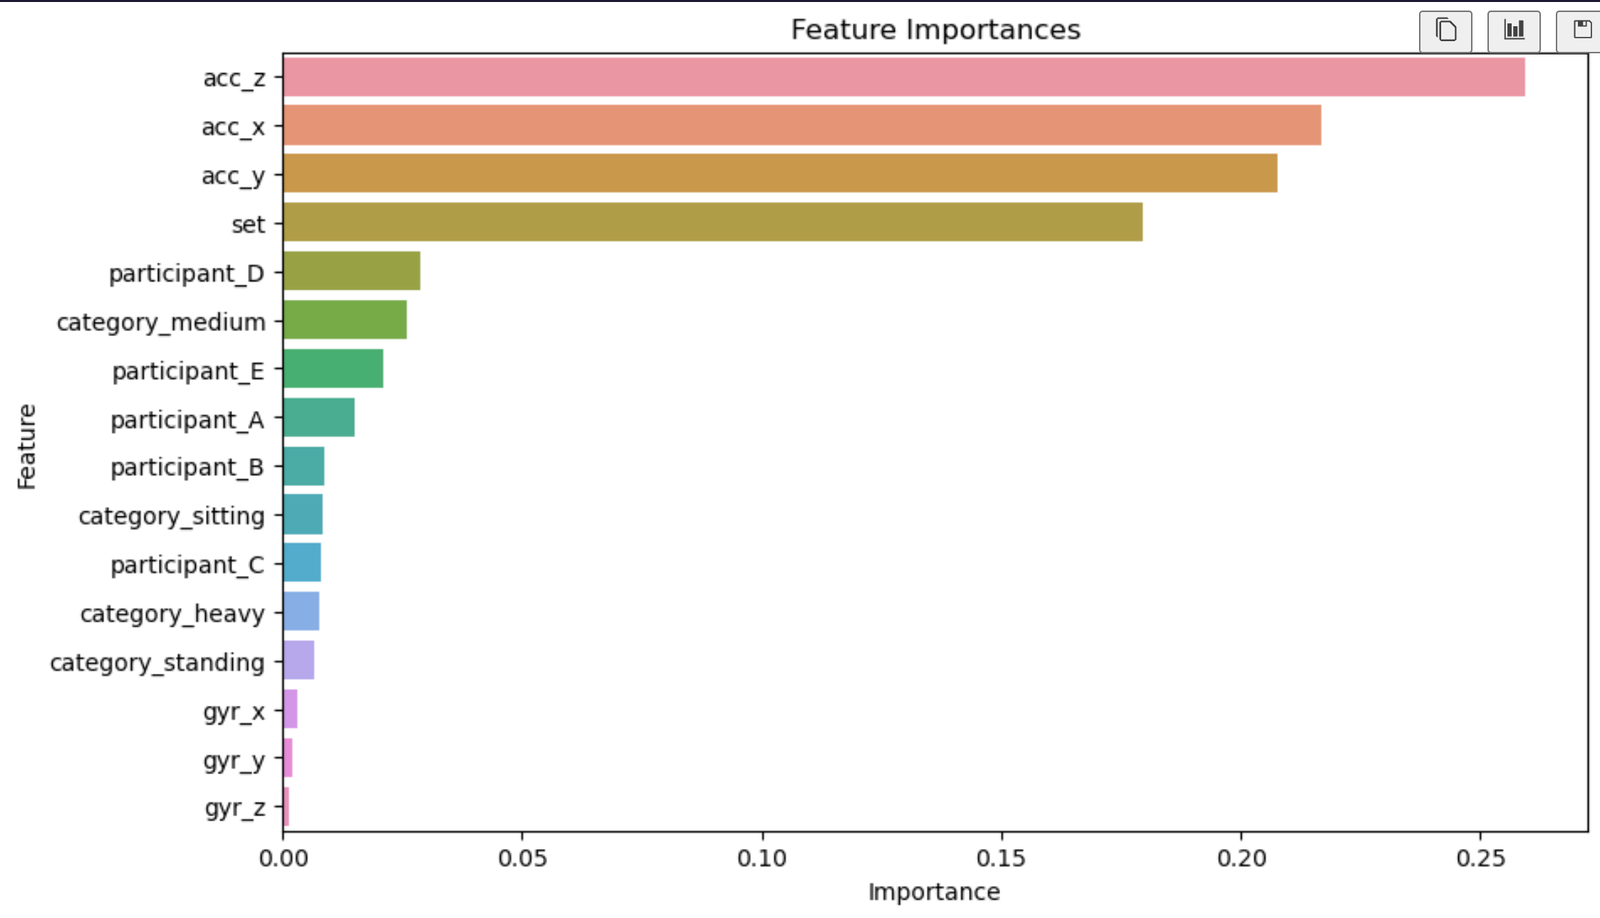
Feature Importance
Confusion Matrix
We conclude that implementation of decision tree is a suitable fit for our dataset as our goal is to assess how quantification and tracking one's fitness correlates with one's overall fitness level and feature importance plot gives us insight about the significance of each feature. Moreover, after analyzing the confusion matrix and accuracy level of 0.98 we conclude that this model is relevant. The plot for decision tree gives us insight how the decision tree classifier makes decision based on the features in the dataset. The Nodes represent the decision point and edges represent the decision paths taken by the classifier. Leaves represent the final decision outcome
Support Vector Machines
Overview
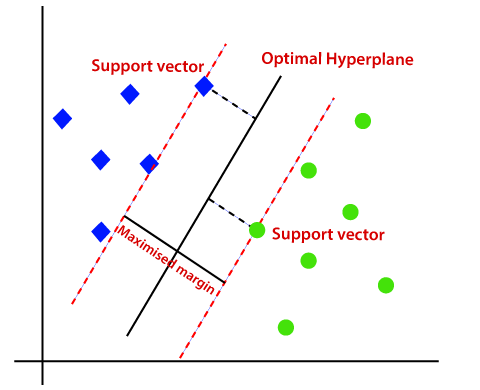
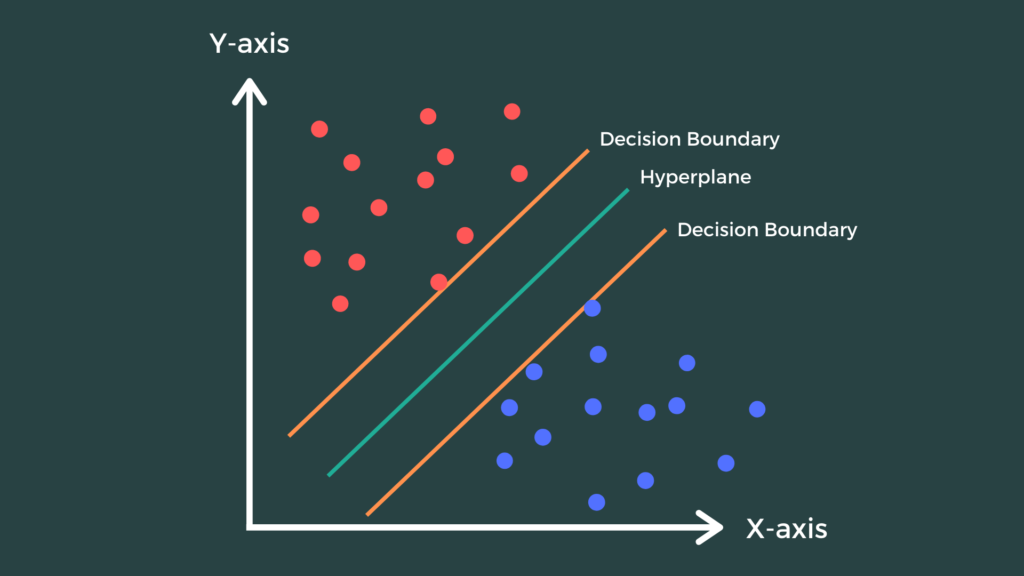
Support vector machine is a supervised machine learning algorithm that utilizes a classification algorithm to classify a two-group classification problem. It uses labeled data to train the model. A key component in improving Support Vector Machines' (SVM) capacity for generalization is Structural Risk Minimization (SRM). Fundamentally, SRM seeks to balance the reduction of model complexity to avoid overfitting with the minimization of empirical risk, or training error. The algorithm prioritizes finding a decision boundary that fits training data well and also generalizes well to new data, thanks to the incorporation of SRM principles into SVM. For SVM to function well in real-world applications where adaptability to new data is critical, this emphasis on generalization is essential. SVM is able to produce more accurate and dependable predictions by optimizing the trade-off between bias and variance through SRM. Moreover, Support Vector Machines (SVM) are based on the Maximum Margin Classifier concept, which offers a strong foundation for binary classification tasks. Finding the hyperplane that maximizes the margin, that is, the distance between the hyperplane and the closest data points from both classes, or support vectors, is the fundamental goal of the Maximum Margin Classifier. In mathematical terms, this is figuring out the hyperplane parameters that will maximize the margin while simultaneously separating the data by solving an optimization problem. By optimizing the margin, the classifier improves its generalization performance by becoming more robust against noise and anomalies in the data.
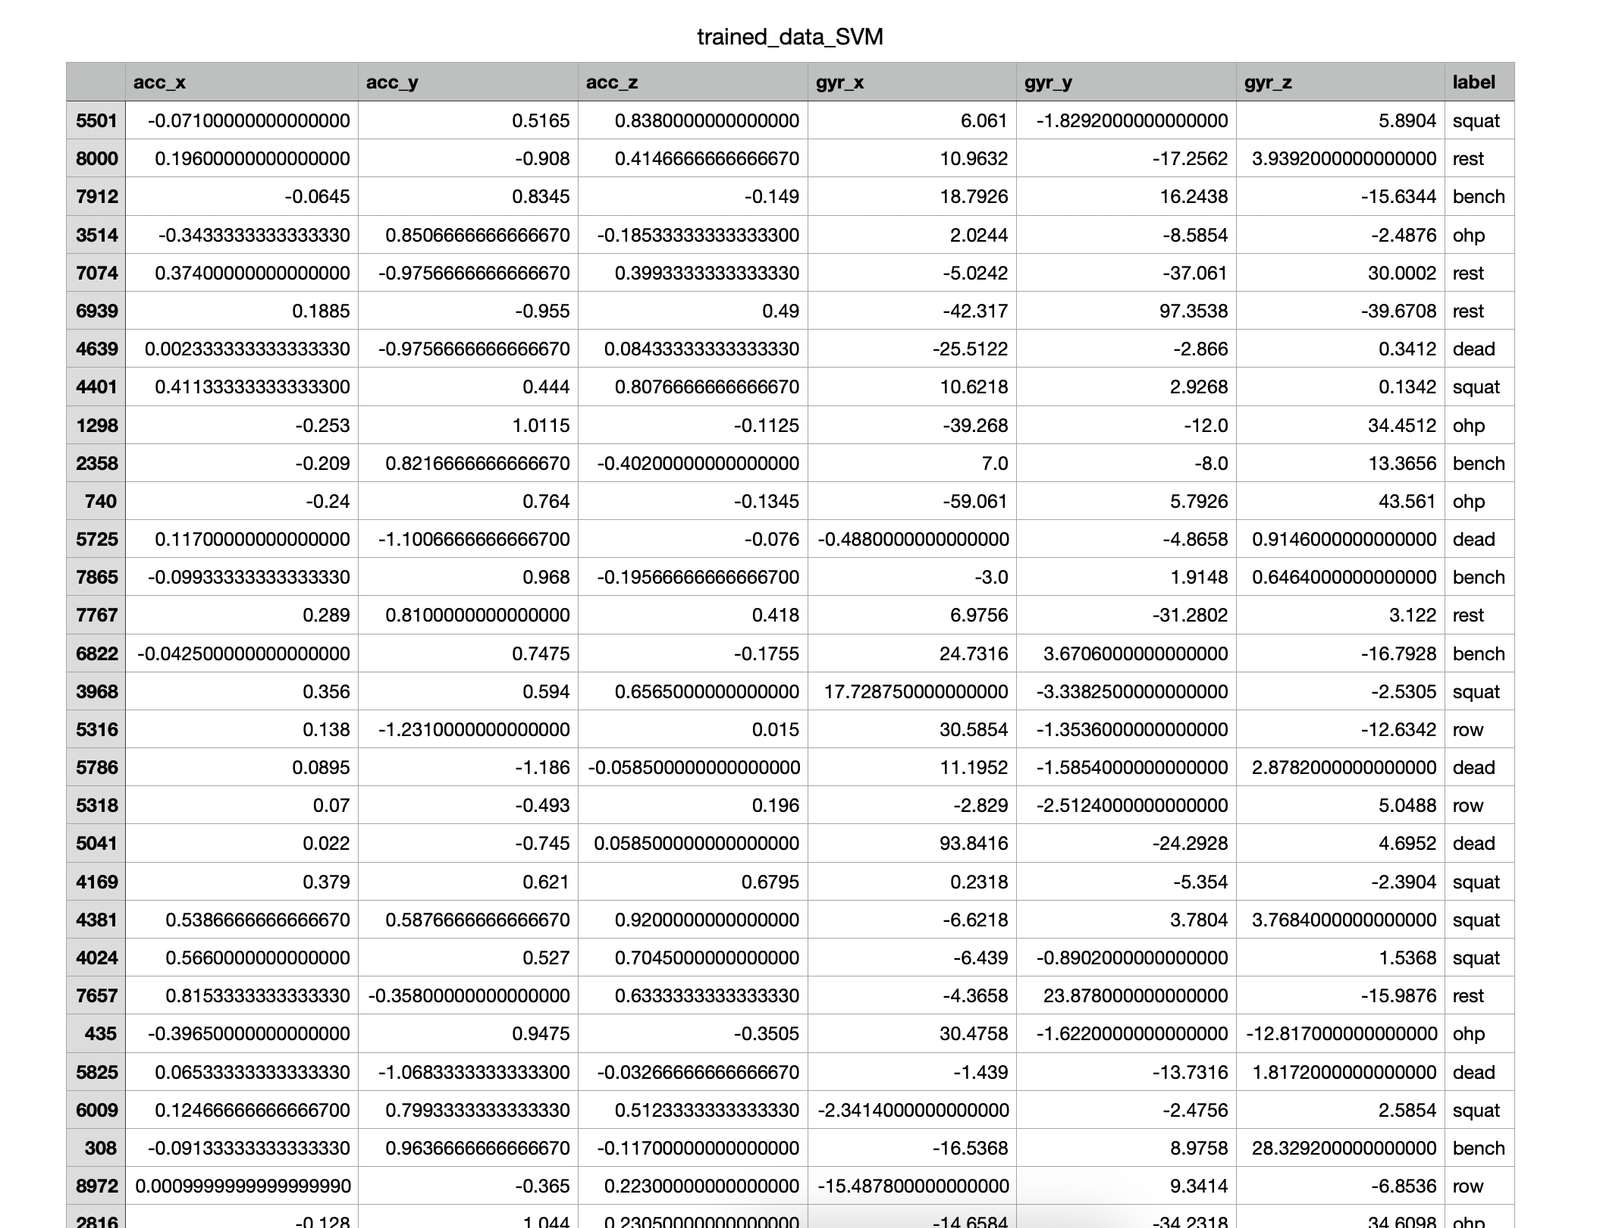
Data Prep
Data has been collected from Metamotions, a wearable device that offers real-time and continuous monitoring of motion and environmental sensor data. The raw data involves accelerometer and gyroscope measurements of all the participants involved during their workout session. Dataset was created after itering over numerous files of raw data, cleaning it, preprocessing it, and finally merging it into one pickle dataset. The reason the dataset was exported as pickle over csv is because it involved numerous timestamps in epoch.
Before Transformation
Cleaned Data
Trained Data
Results and Conclusion
Confusion Matrix 1
Confusion Matrix 2

Confusion Matrix 3

Confusion Matrix 4
Confusion Matrix 5
Confusion Matrix 6
Confusion Matrix 7

Confusion Matrix 8
Confusion Matrix 9

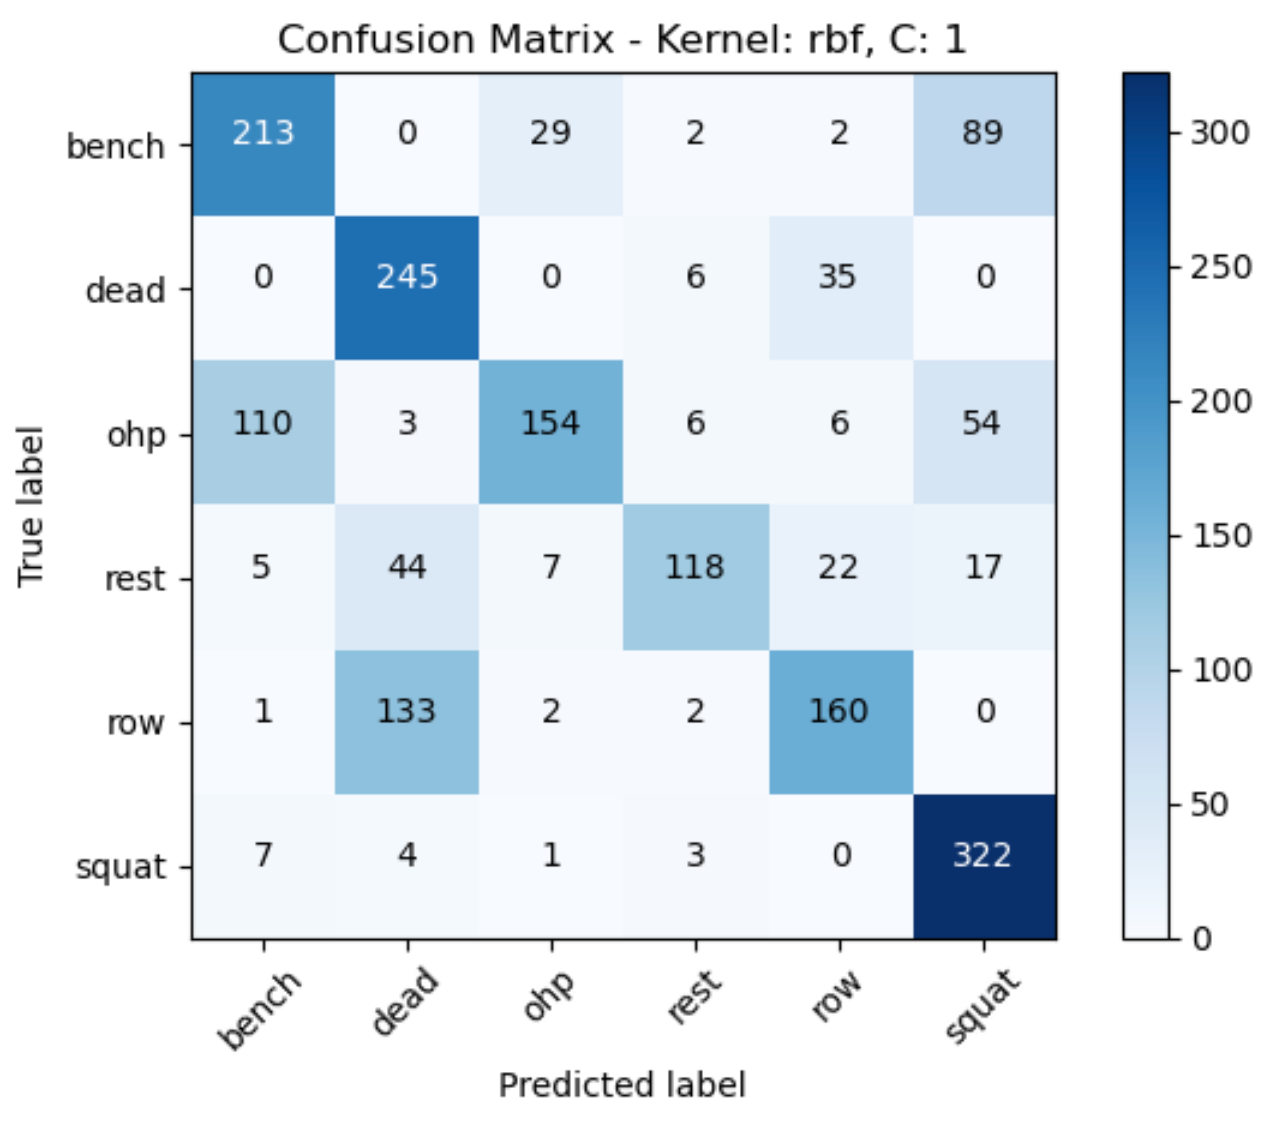
Visualization

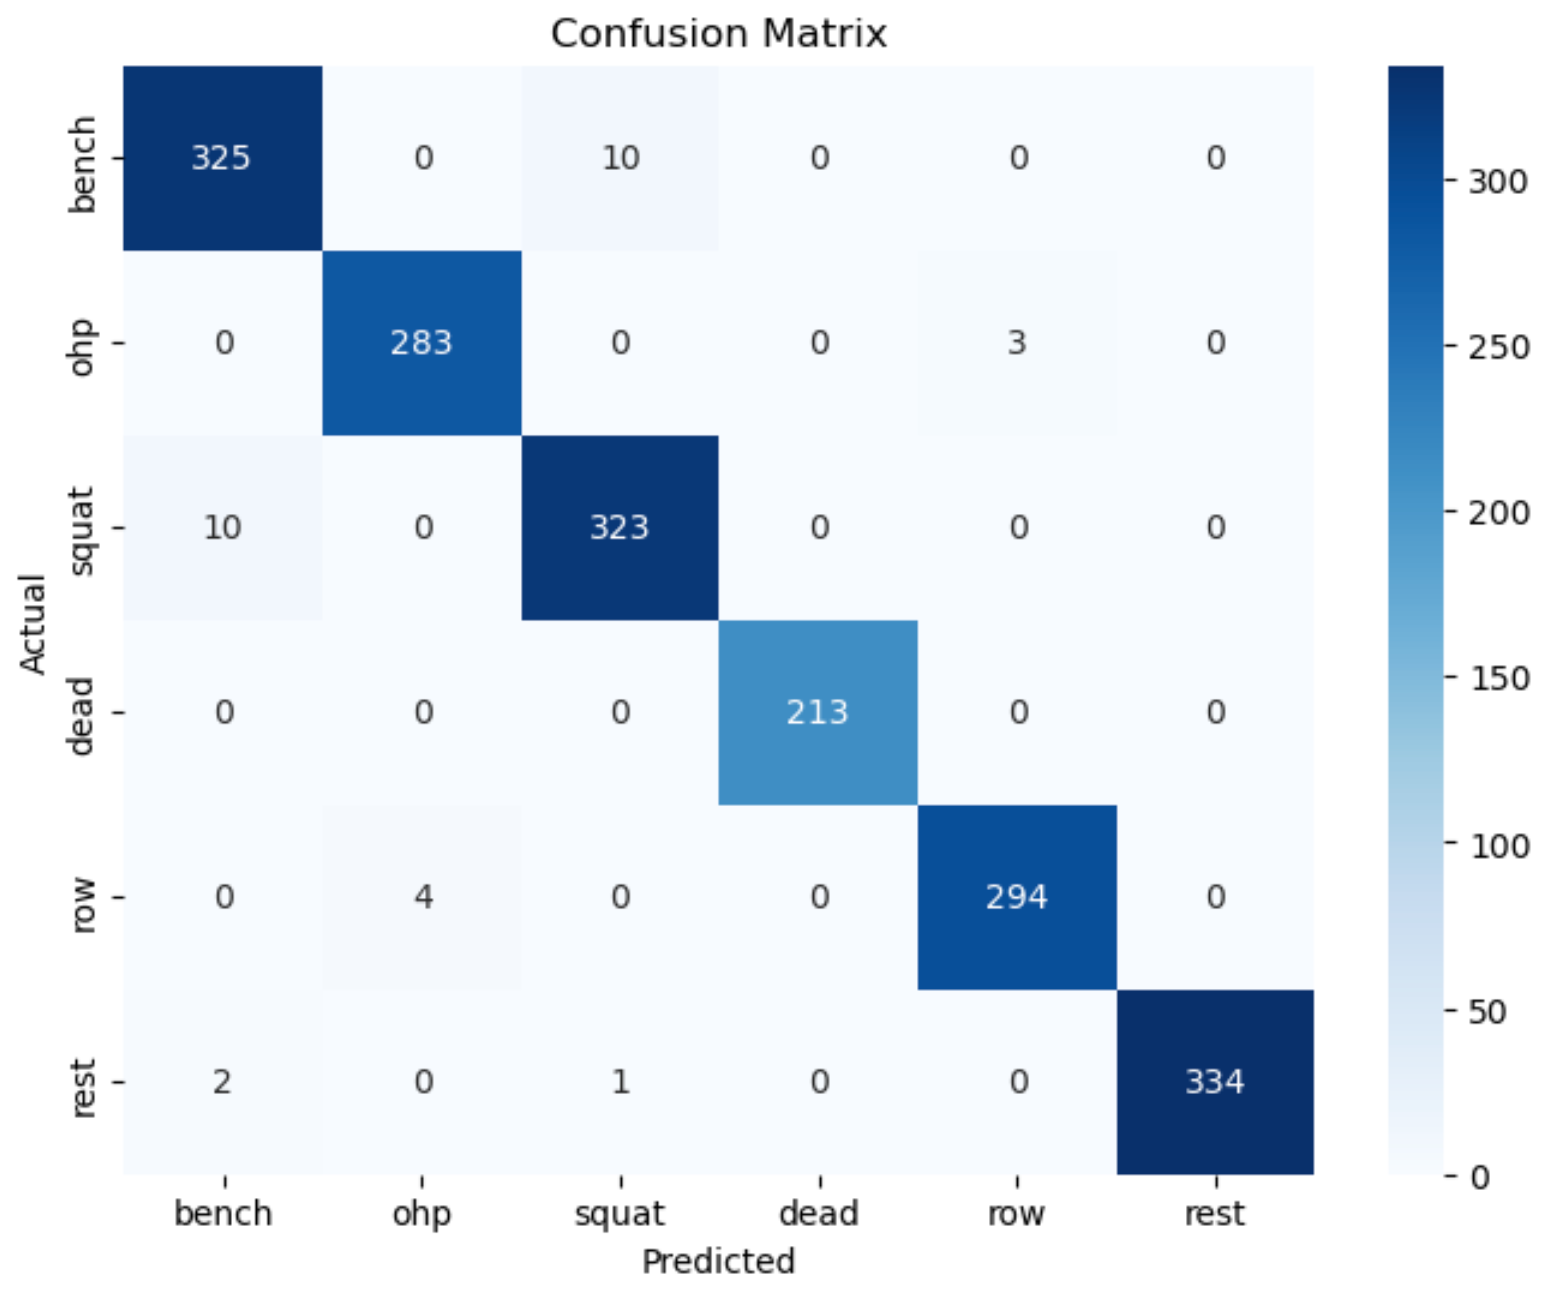
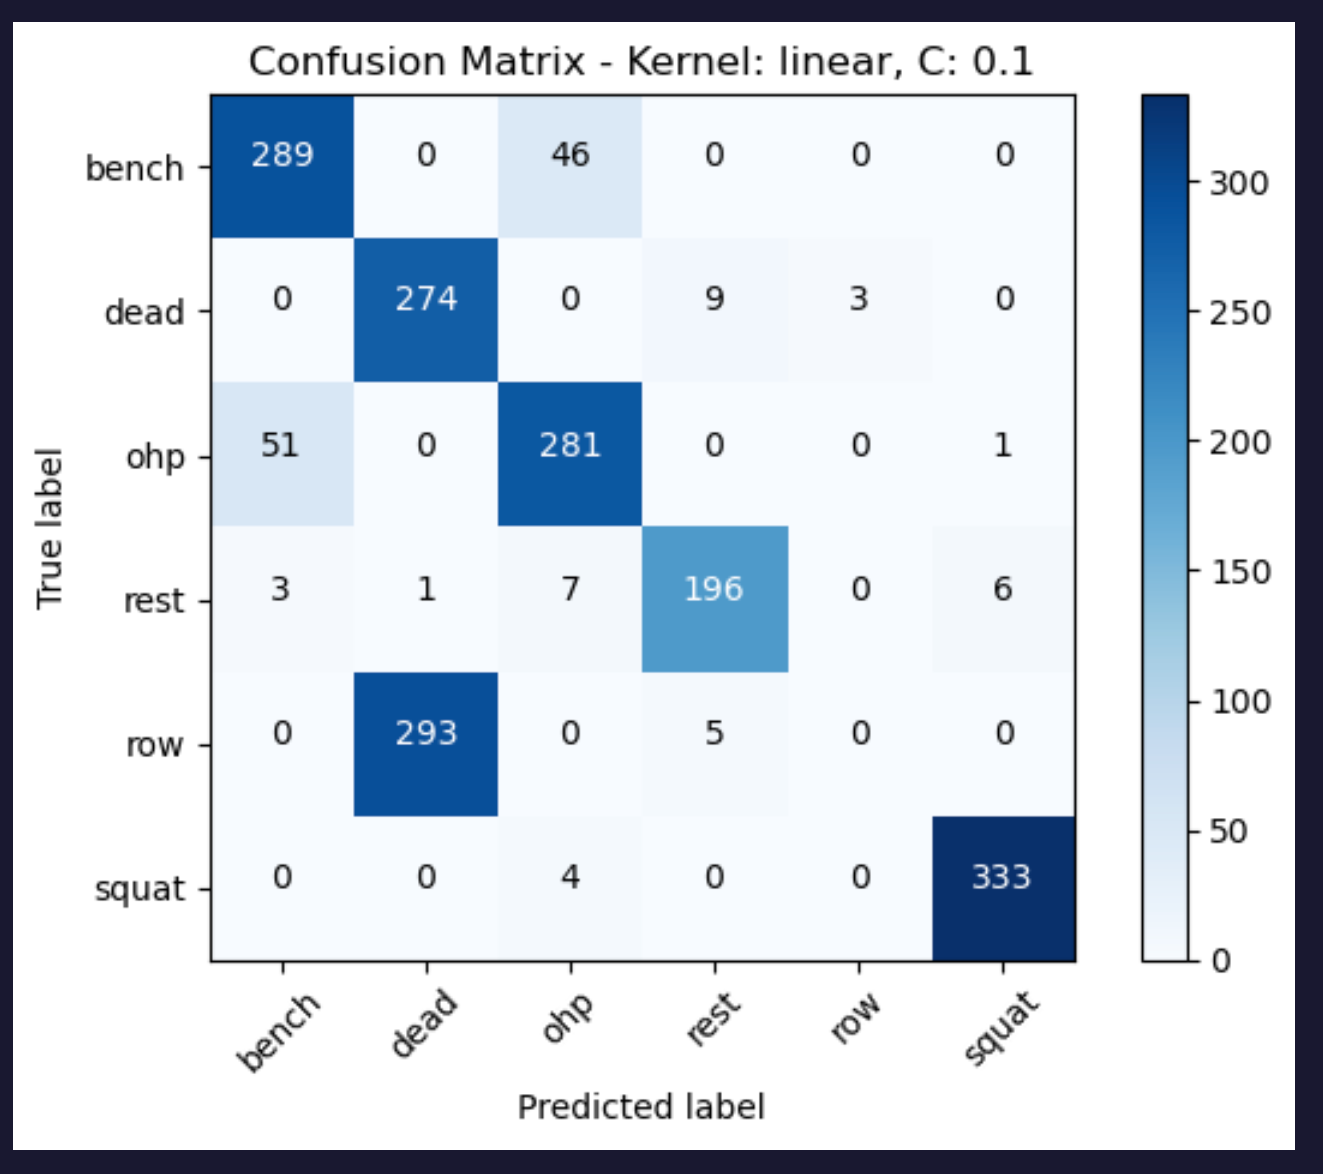
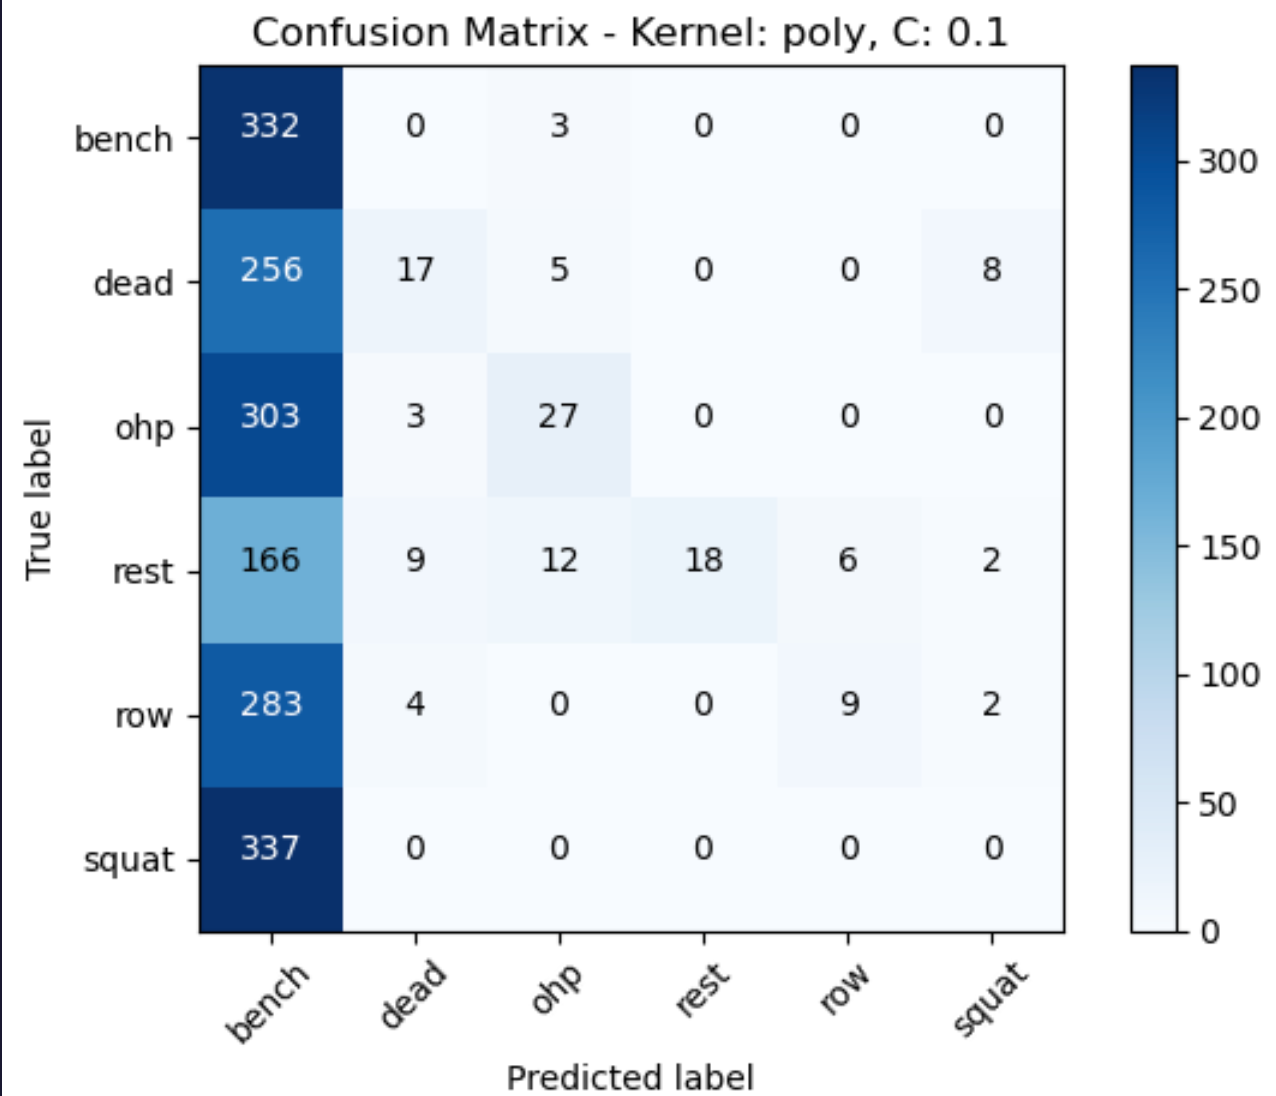
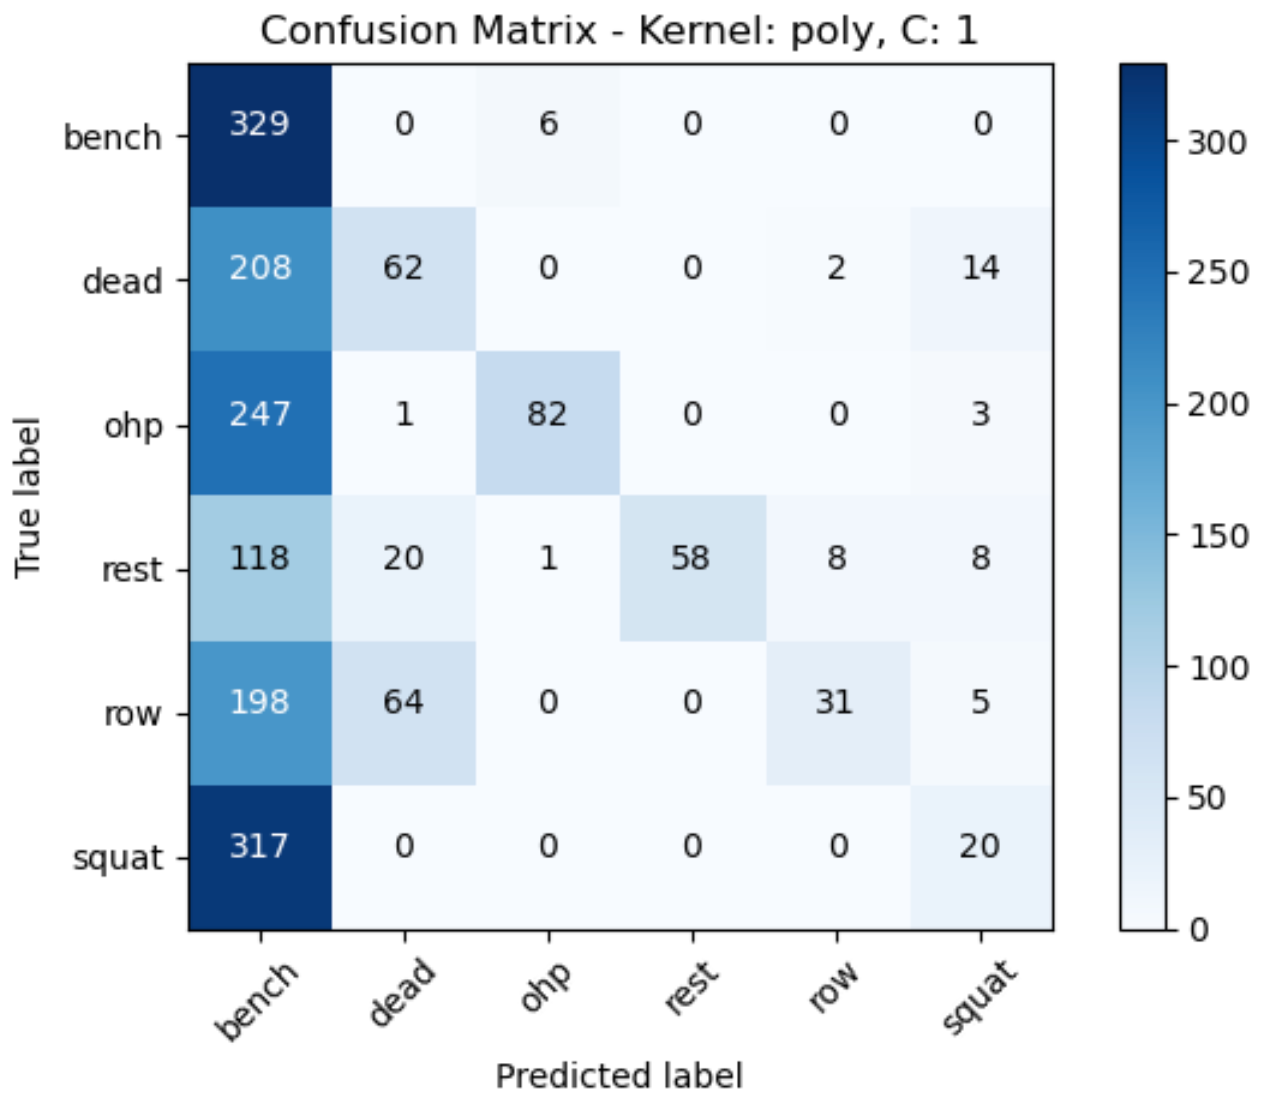
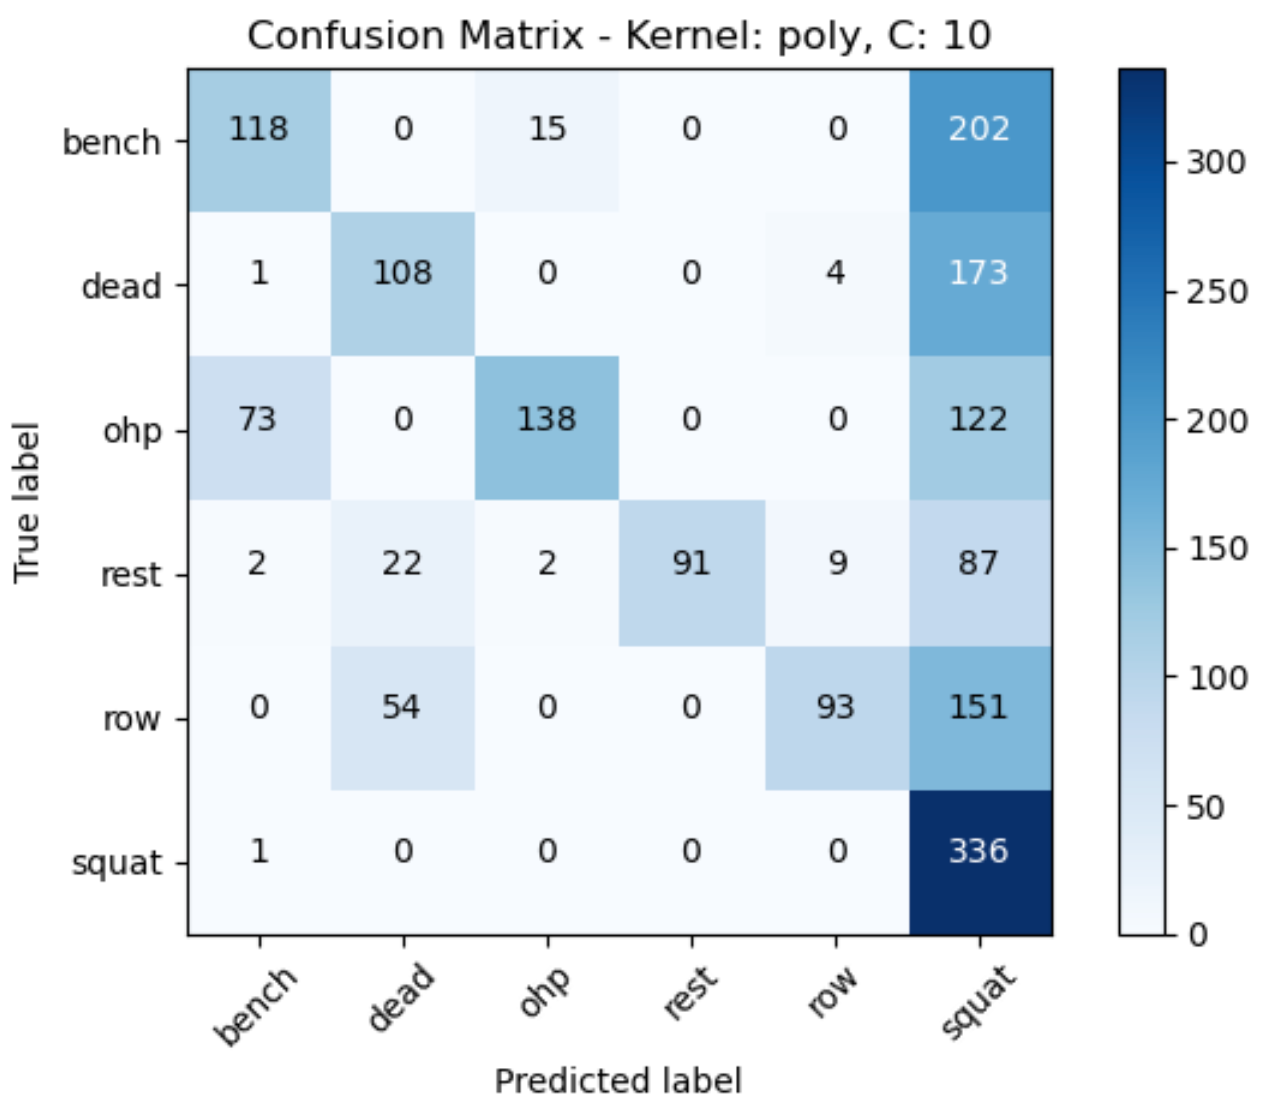
The accuracy scores of the models was computed based on the confusion matrices by analyzing the diagonal elements (true positives) and divide it by the sum of all elements to get the accuracy score.
The accuracy scores we obtained are:
- Accuracy for linear kernel with C=0.1: 0.76
- Accuracy for linear kernel with C=1: 0.82
- Accuracy for linear kernel with C=10: 0.83
- Accuracy for poly kernel with C=0.1: 0.22
- Accuracy for poly kernel with C=1: 0.32
- Accuracy for poly kernel with C=10: 0.49
- Accuracy for rbf kernel with C=0.1: 0.50
- Accuracy for rbf kernel with C=1: 0.67
- Accuracy for rbf kernel with C=10: 0.79
However, even after implementing the support vector machine algorithm the decision boundary couldn’t be determined as all the data points are close to each other. It can be concluded that a linear kernel with a C value of 10 has produced the best model with accuracy score of 0.83.
Neural Networks
Overview
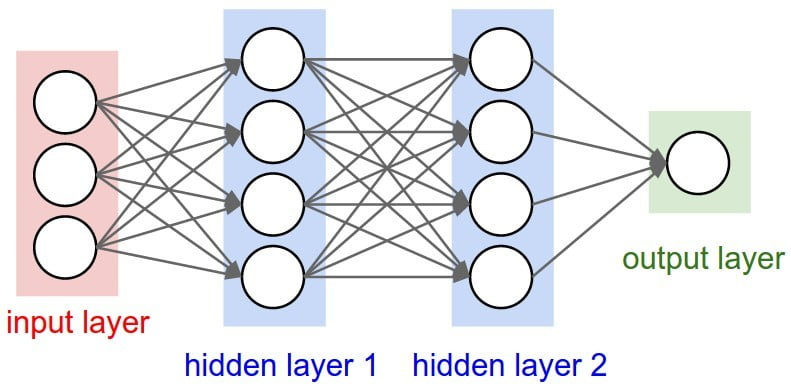
Inspired by the structure and various functions of the human brain, neural networks are computational models that seek to identify patterns and relationships in data. The neural network comprises interconnected nodes, or neurons that process information via forward propagation, in which certain inputs lead to output generation through means of a sequence of weighted connection and activation functions. Neural networks learn to perform tasks such as classification, regression, and pattern recognition, by adjusting internal parameters to minimize the difference between expected and actual outputs through iterative training methods like backpropagation.
Data Prep
Data has been collected from Metamotions, a wearable device that offers real-time and continuous monitoring of motion and environmental sensor data. The raw data involves accelerometer and gyroscope measurements of all the participants involved during their workout session. Dataset was created after itering over numerous files of raw data, cleaning it, preprocessing it, and finally merging it into one pickle dataset. The reason the dataset was exported as pickle over csv is because it involved numerous timestamps in epoch.
Before Transformation
Cleaned Data
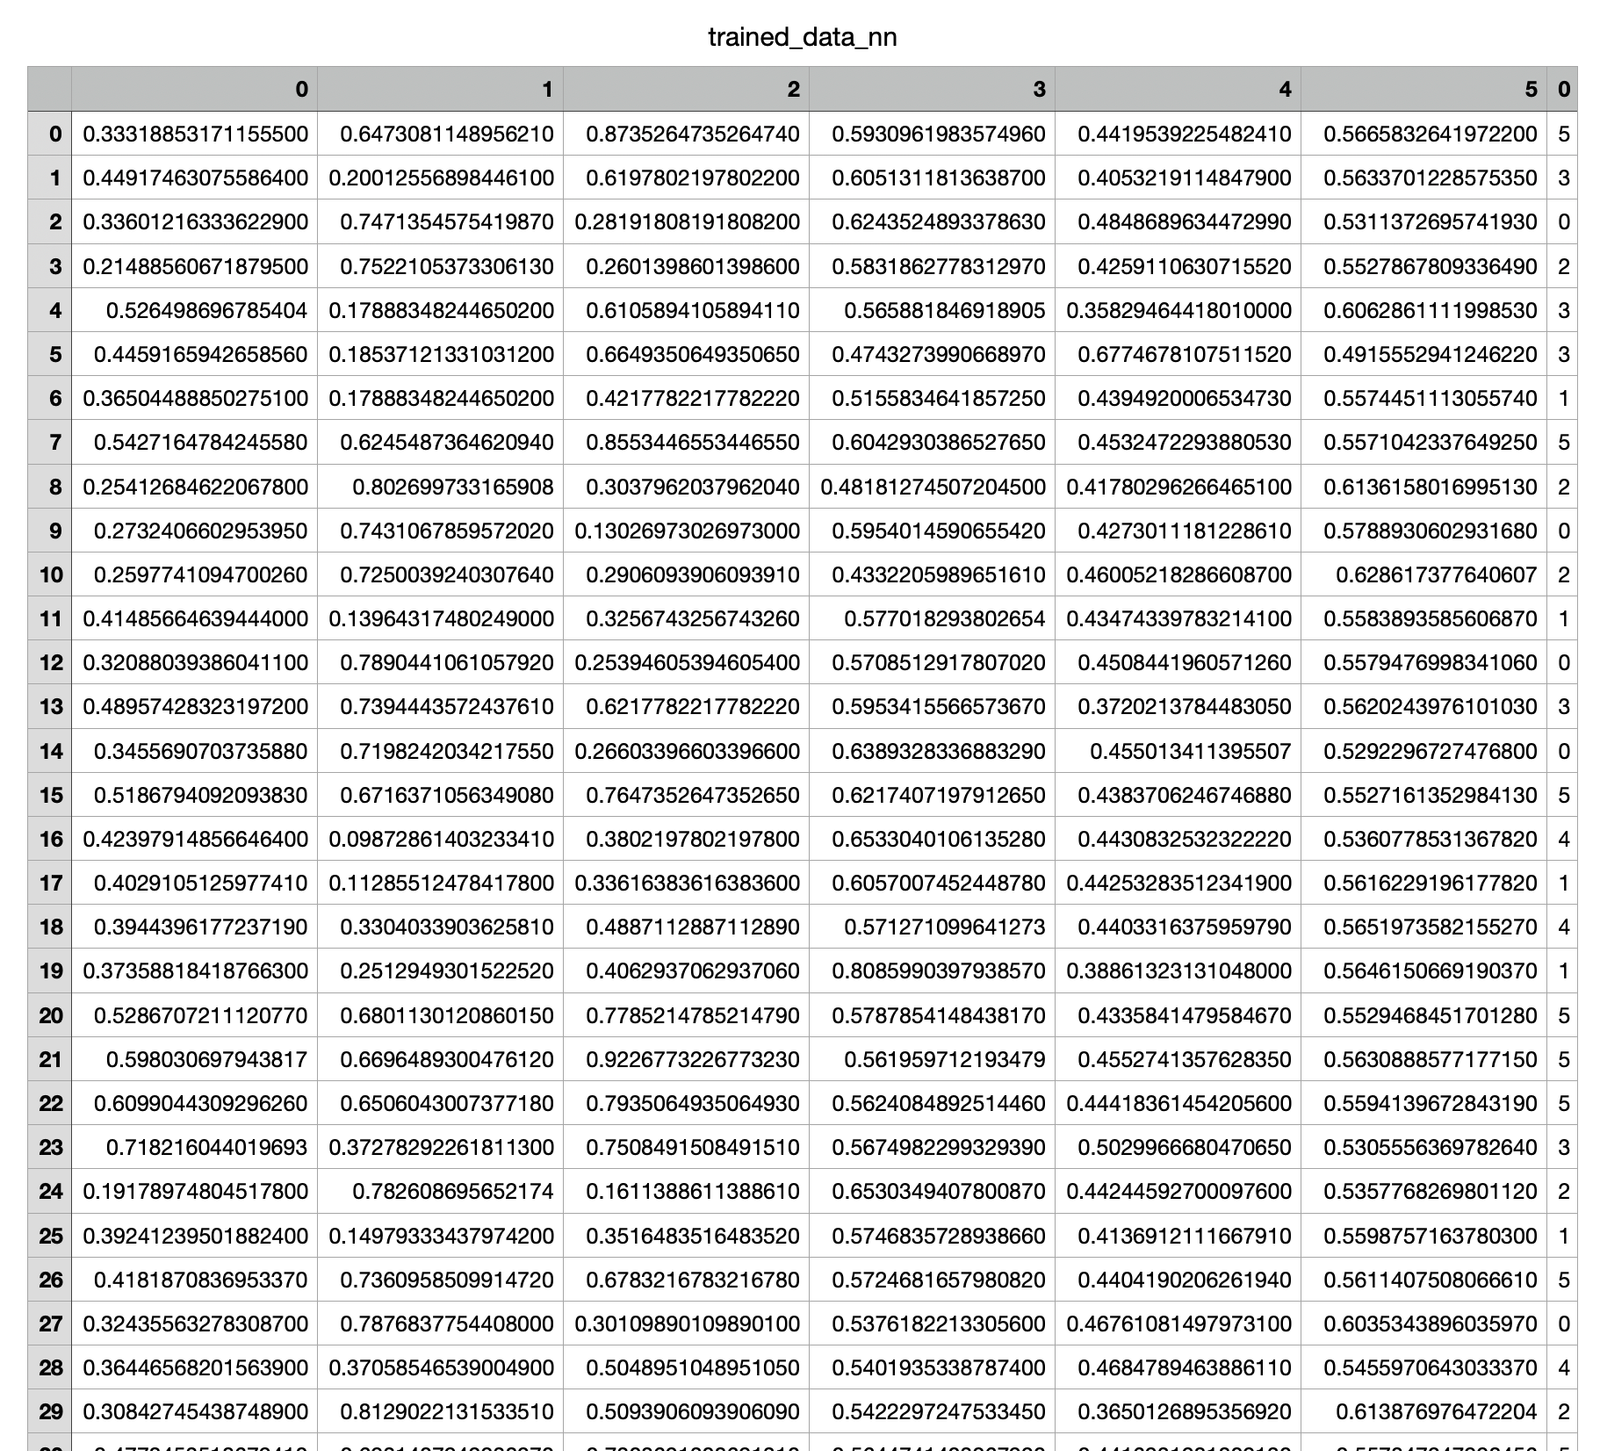
Trained Data
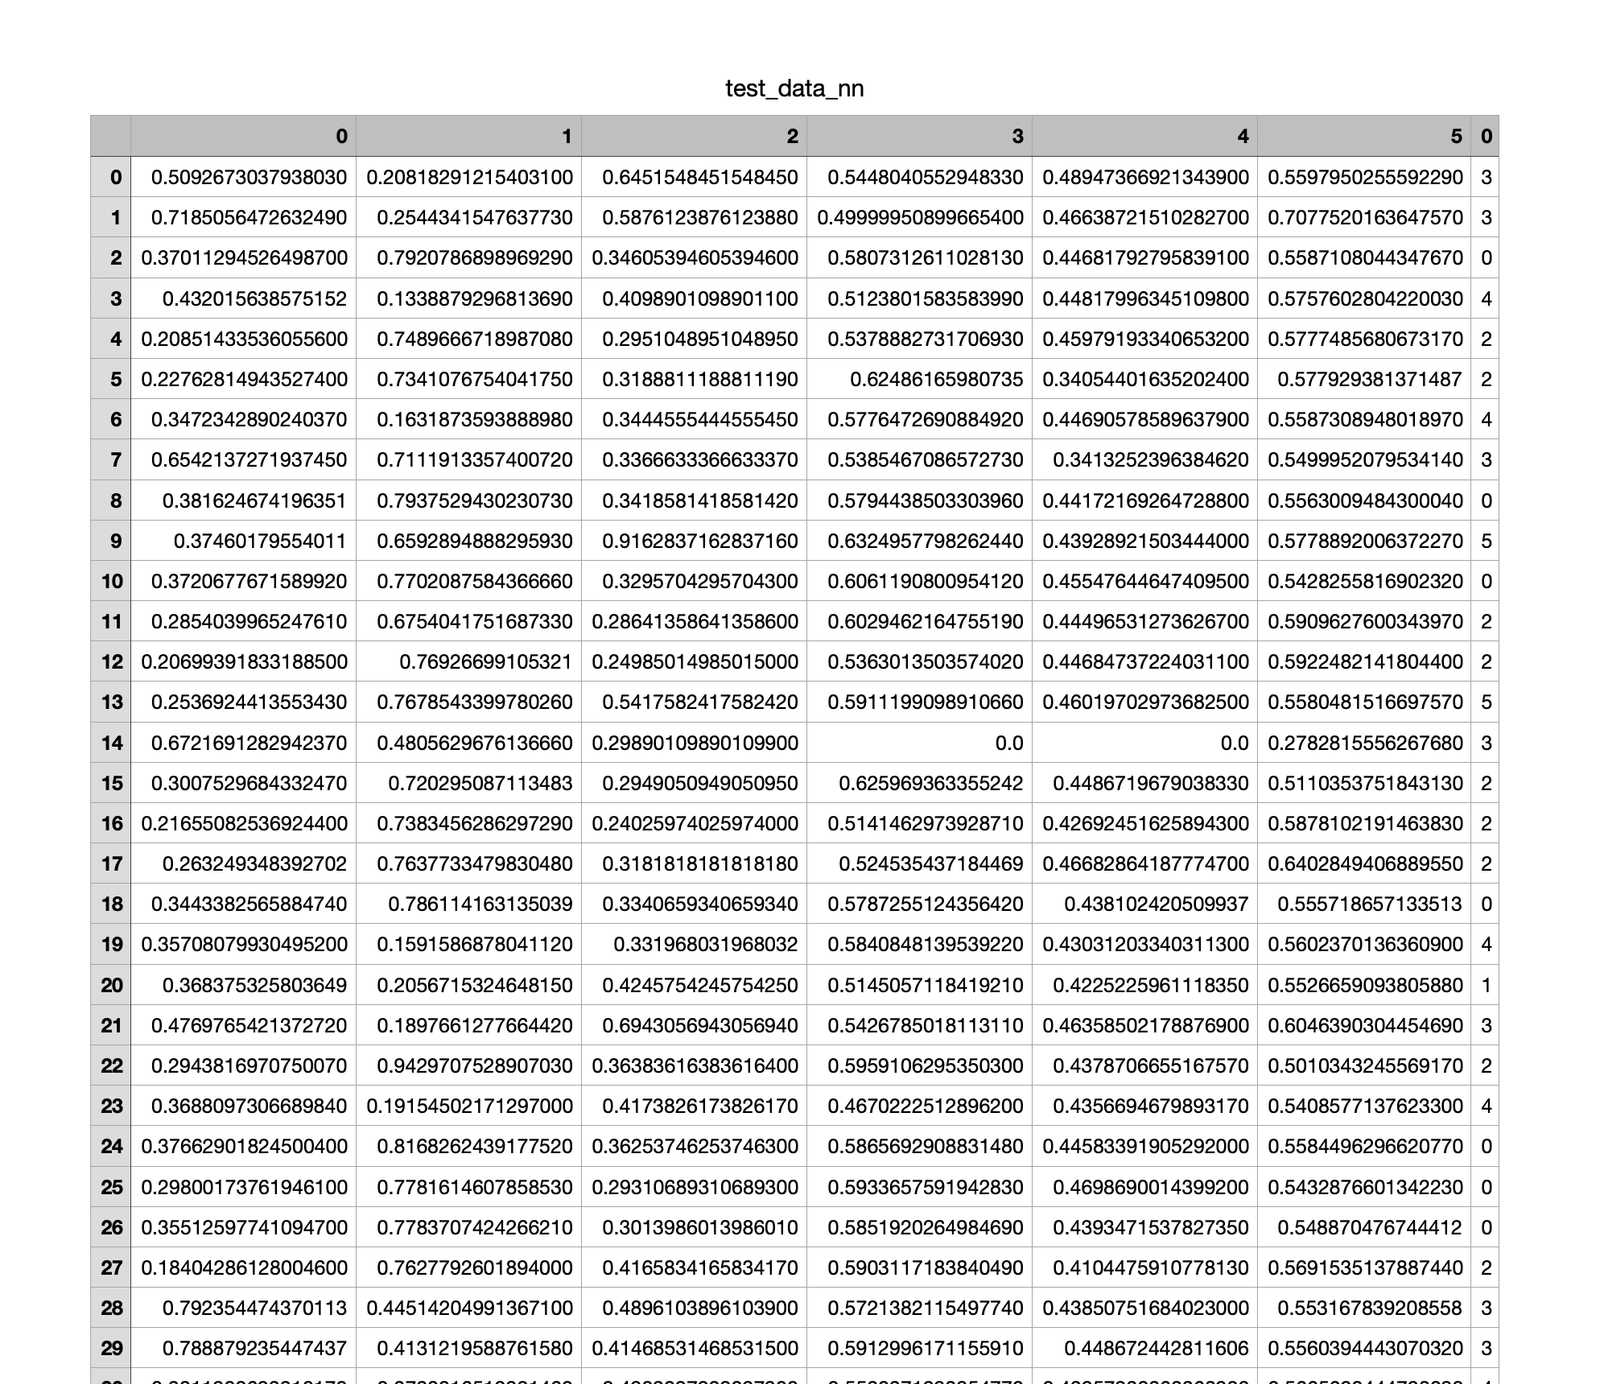
Test Data
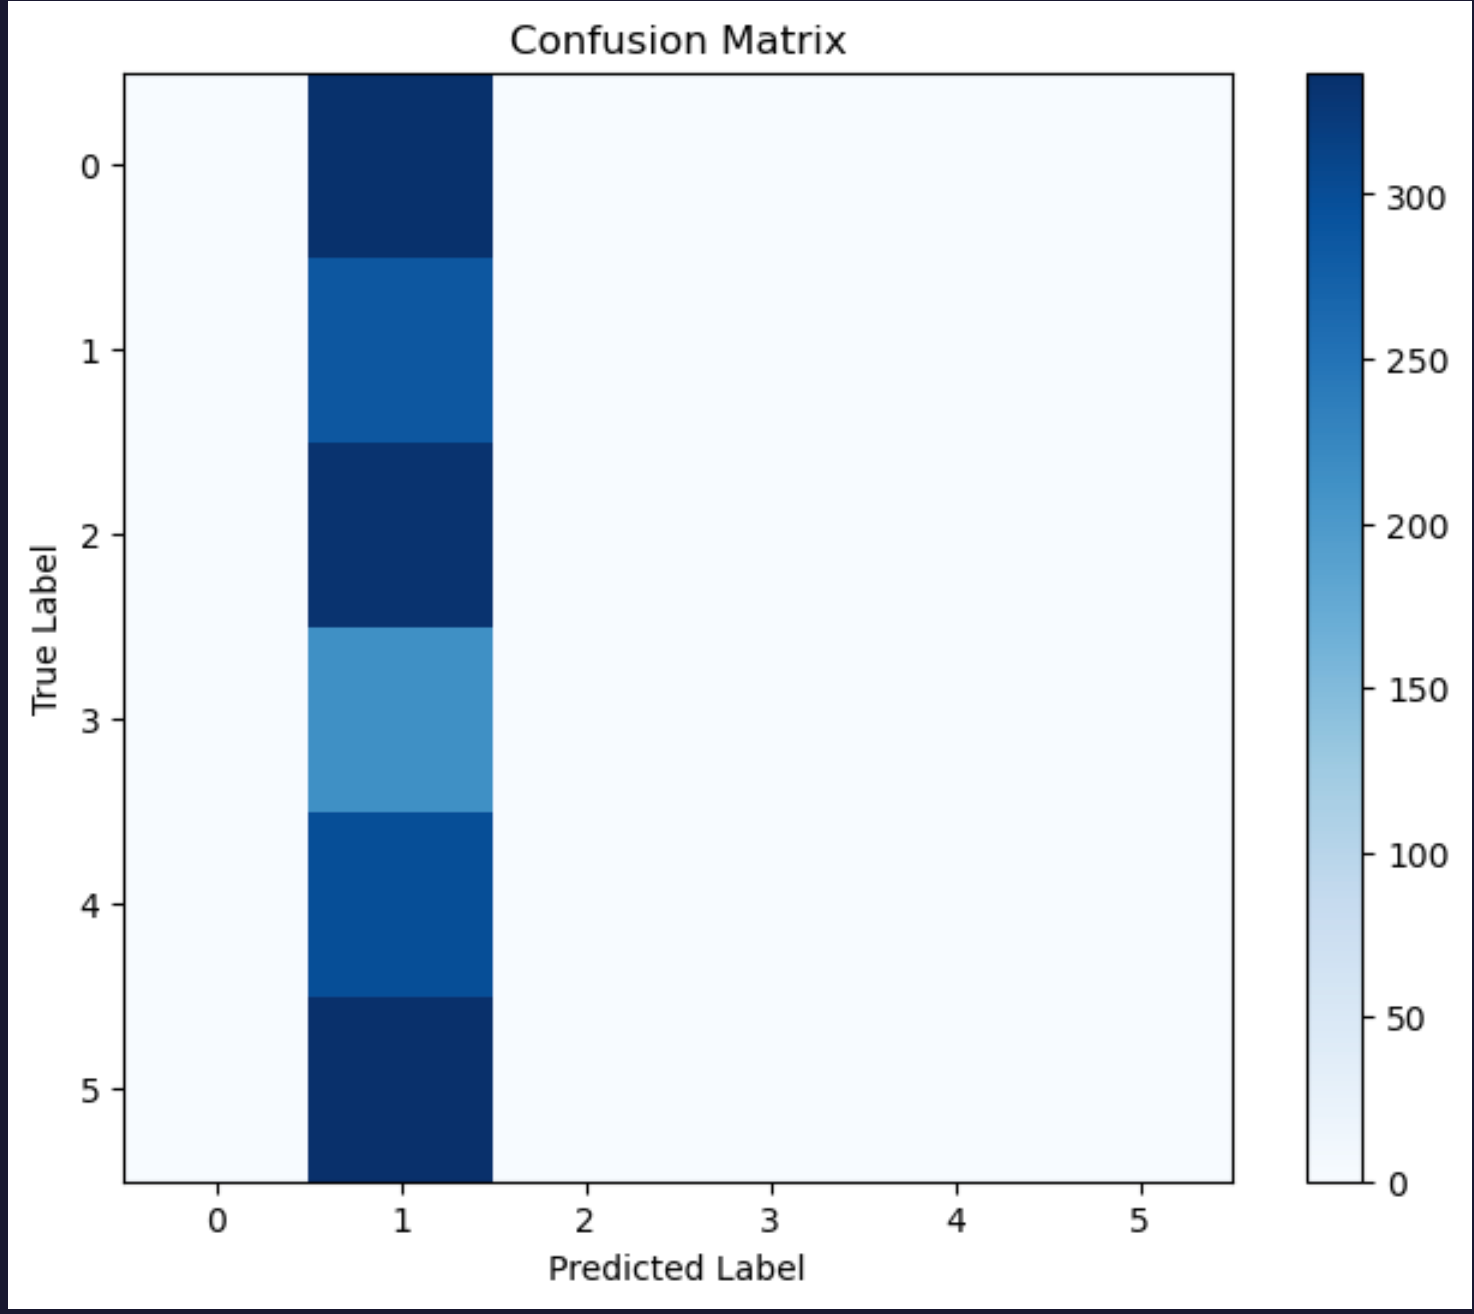

The model generated from the neural network implementation is not learning effectively from the data. It seems to be predicting only one class for all possible instances, which is leading higher accuracy in that particular class but poor performance overall. There are also issues of underfitting present in the model as the model architecture is not complex enough to take into account all the possible relationships.

Linear Regression
Overview
Linear regression falls under a statistical method that is used to model the relationship between a dependent variable and one or more independent variables through means of fitting a linear equation to the observed data. It is implemented by estimating, from the independent variables, the coefficients of the linear equations that best takes into account the variability in the dependent variable. Although linear regression is simple and easy to understand, its limitations include its prior assumption of linearity between variables, sensitivity to outliers, and inability to capture complex nonlinear relationships. Moreover, it assumes constant variance and independence of observations which is not always the case when raw real data is collected and preprocessed.
Data Prep
Data has been collected from Metamotions, a wearable device that offers real-time and continuous monitoring of motion and environmental sensor data. The raw data involves accelerometer and gyroscope measurements of all the participants involved during their workout session. Dataset was created after itering over numerous files of raw data, cleaning it, preprocessing it, and finally merging it into one pickle dataset. The reason the dataset was exported as pickle over csv is because it involved numerous timestamps in epoch.
Before Transformation
Cleaned Data
Modified Data

Results and Conclusion
Linear Regression Fit
Logistic Regression Fit

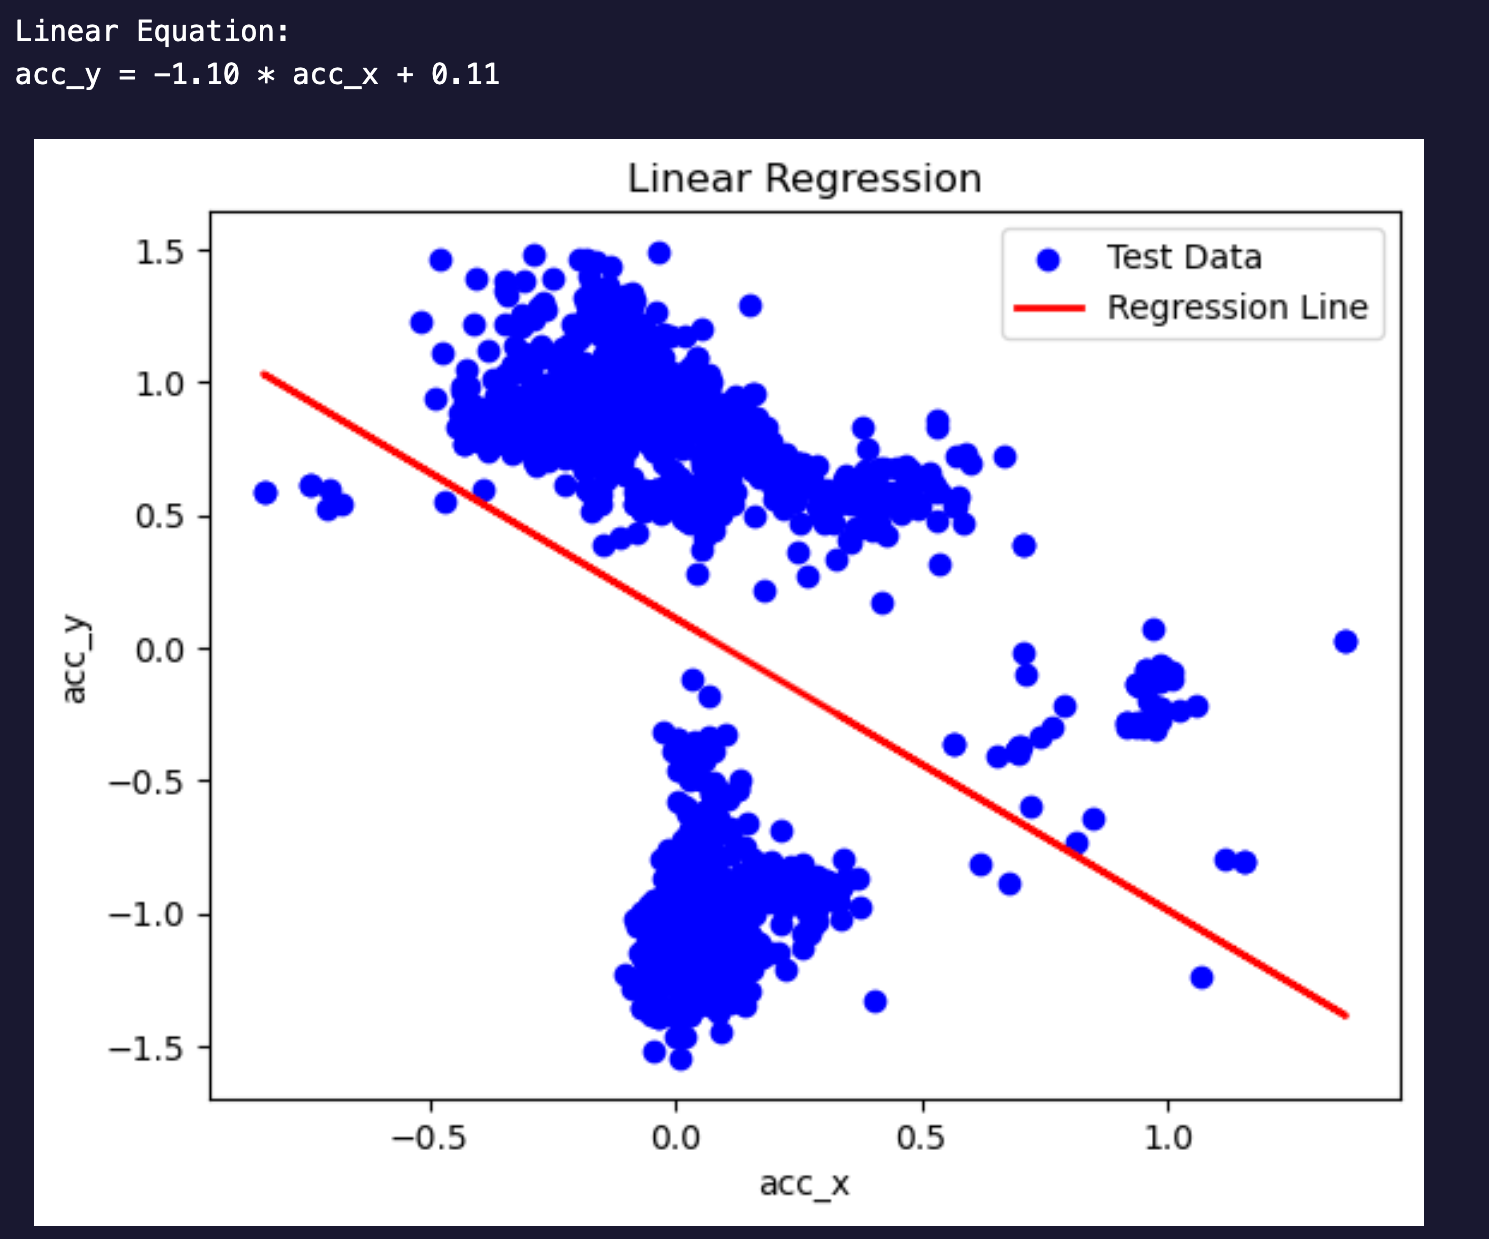
The linear equation obtained for the linear regression model is acc_y = -1.10*acc_y + 0.11. A negative coefficient for slope indicates an inverse relationship between the independent variable ‘acc_x’ and the dependent variable ‘acc_y.’ Where acc_x and acc_y are accelerometer readings captured using the Metamotions device, logistic regression has been performed alongside the categorical variable ‘label’ which is basically the type of exercise. The logistic regression model computes the probability of belonging to a certain observation to each class (e.g, bench, ohp, squat, row)
Conclusion
The objective of this project was to investigate the potential possibilities of context-aware applications in the domain of strength training. The impetus for this project was the lack of focus on the implementation of context-aware applications in the field of activity tracker devices.
During strength training sessions of five participants, data from wristband accelerometers and gyroscope sensors was gathered while the participants performed the five fundamental compound barbell lifts with medium to heavy weights. To ensure participants were trained to failure the 1RM (one rep max) technique was employed. The most effective exercise categorization model was developed upon the implementation of the Decision Tree and Random Forest upon subjecting the preprocessed data to machine learning for the quantified self-cycle. The model was able to classify unseen cases with an overall accuracy of ~98%. However, the model could not achieve a perfect accuracy score which can be attributed to the fact that it wrongfully classified some bench press instances as overhead press movements and vice-versa. The same holds true for deadlifts and rows. A possible reason could be the similarity of the movement of the exercise pairs.
After performing some Clustering tests the optimal number of clusters was determined to be 4 upon analyzing the elbow plot and determining the silhouette score. Cluster 1 covers almost all of the bench press and overhead press data. This could be attributed to the fact that both exercises involve similar patterns of movement. Squat is captured in cluster 2 while the deadlift and row are captured in cluster 3. Cluster 4 captures the remainder of the data but fails to classify them accurately. Additionally, hierarchical clustering was performed after sampling the dataset for 50 data points to plot the dendrogram.
Principal Component Analysis and Naive Bayes have also been implemented. However, they were judged to be unsuitable because it takes 4 principal components to retain at least 90% of the explanatory power of the dataset while 2 principal components can barely retain 51% of the explanatory power. Perhaps, implementation of Fourier transformation is necessary before implementing Principal Component Analysis. As for the Naive Bayes algorithm, the accuracy score of 59% is far too poor to even consider optimization.
Support Vector Machines were deployed with three different C values (0.1, 1, 10) and three different kernels (linear, poly, rbf). The accuracy score of the models was computed based on the confusion matrices by analyzing the diagonal elements (true positives) and dividing it by the sum of all elements to get the accuracy score. However, the decision boundary or the hyperplane could not be determined because of the proximity of the data points. The optimal C value and kernel pair were determined to be C = 10, kernel = linear with an accuracy score of 83%.
Finally, Neural networks and regression were implemented. The model generated from the neural network implementation is not learning effectively from the data. It seems to be predicting only one class for all possible instances, which leads to higher accuracy in that particular class but poor performance overall. There are also issues of underfitting present in the model as the model architecture is not complex enough to take into account all the possible relationships. The linear equation obtained for the linear regression model is acc_y = -1.10*acc_y + 0.11. A negative coefficient for slope indicates an inverse relationship between the independent variable ‘acc_x’ and the dependent variable ‘acc_y.’ Where acc_x and acc_y are accelerometer readings captured using the Metamotions device, logistic regression has been performed alongside the categorical variable ‘label’ which is the type of exercise. The logistic regression model computes the probability of belonging to a certain observation to each class (e.g, bench, ohp, squat, row).